


Welcome back to your weekly market checkup!
I hope you had an awesome week!
ICYMI, you can see the latest Top Pick of the Week here →
Top Pick of the Week: When Fundamentals Meet Momentum

There’s a difference between finding a company I want to own and finding the right time to pay attention to its stock.
Let’s dig into last week’s market recap and the playbook for the week ahead →
Oil USO 0.00%↑ dominated, stocks struggled, bonds TLT 0.00%↑ and gold GLD 0.00%↑ stayed weak and underneath the major indexes, leadership started shifting.
Technology XLK 0.00%↑ , Semiconductors SOXX 0.00%↑ , and Communication Services XLC 0.00%↑ are showing strength while several other areas of the market are starting to crack.
Then Friday gave us another clue. Hot inflation increased expectations for a Fed rate hike—and stocks rallied anyway.
Wait.
Higher inflation. Higher rate expectations. Stocks UP?
Welcome to the market. 😂
So this week, I’m watching two things:
Where is the strength?
And...where are the cracks?
Let’s get into it.
I. The Market Vitals (Best to Worst)
Oil won. Everything else was fighting for second.
Let’s start with the big picture.
Across the seven major assets I track, USO was the clear winner while everything else finished red.
The charts tell me what deserves my attention next.
The major indexes aren’t broken, but they aren’t exactly running either, but the SPY and QQQ look like they could be trying to establish accumulation zones.
That’s interesting, but I want to see them hold.
The Dow Jones DIA 0.00%↑ looks weaker. DIA remains above its 200-day SMA, but it has fallen below its shorter-term averages and momentum has deteriorated.
So while the longer-term trend remains intact across the major indexes, short-term momentum is giving us a mixed picture.
One divergence I’m watching is that GLD is below its 200-day while GDX remains above its own.
I’m not drawing a conclusion from that yet, but it’s on my radar.
Bitcoin (BTC) is still comfortably above its 200-day SMA after its huge August breakout.
Short term, though, momentum has cooled. So I’m watching to see whether BTC is simply consolidating after a major move or beginning to roll over.
The Fed is about to test this market and here’s where things get interesting.
Hot inflation increased expectations for a quarter-point Fed rate hike.
And on Friday?
Stocks rallied.
Why?
Because markets don’t simply trade headlines.
→ They trade expectations.
You’ve probably heard the old Wall Street saying: “Buy the rumor.” Sell the news.”
Markets often position for an event before it happens. By the time the actual news arrives, some of the expected outcome may already be reflected in price.
This week may have given us the reverse: “Sell the rumor. Buy the news.”
Markets spent much of the week under pressure as yields climbed and expectations for a Fed hike increased.
Then Friday’s inflation report made a hike look even more likely—and buyers stepped back in.
That doesn’t tell me what happens next, but it changes the question I’m asking heading into the Fed meeting.
I’m less interested in: Will the Fed hike?
And more interested in: How does the market react if they do?
→ Because the headline tells you what happened. Price tells you whether the market was surprised.
That’s what I’m watching.
Here’s how the 7 major asset classes ranked this week:
Oil USO 0.00%↑
Bitcoin ($BTCUSD)
The Nasdaq-100 QQQ 0.00%↑
The S&P 500 SPY 0.00%↑
The Dow Jones 30 DIA 0.00%↑
Gold GLD 0.00%↑
20 Year Bonds Treasury ETF TLT 0.00%↑
♥️ Market Pulse: 1/7
1/7 assets is up.
USO is up.
QQQ, SPY, DIA, $BTCUSD, GLD, and TLT are down.
II. Section Rotation (11 SPDR S&P 500 Sectors): Red Doesn’t Mean Equal
Now we move down one level.
Market → Sector.
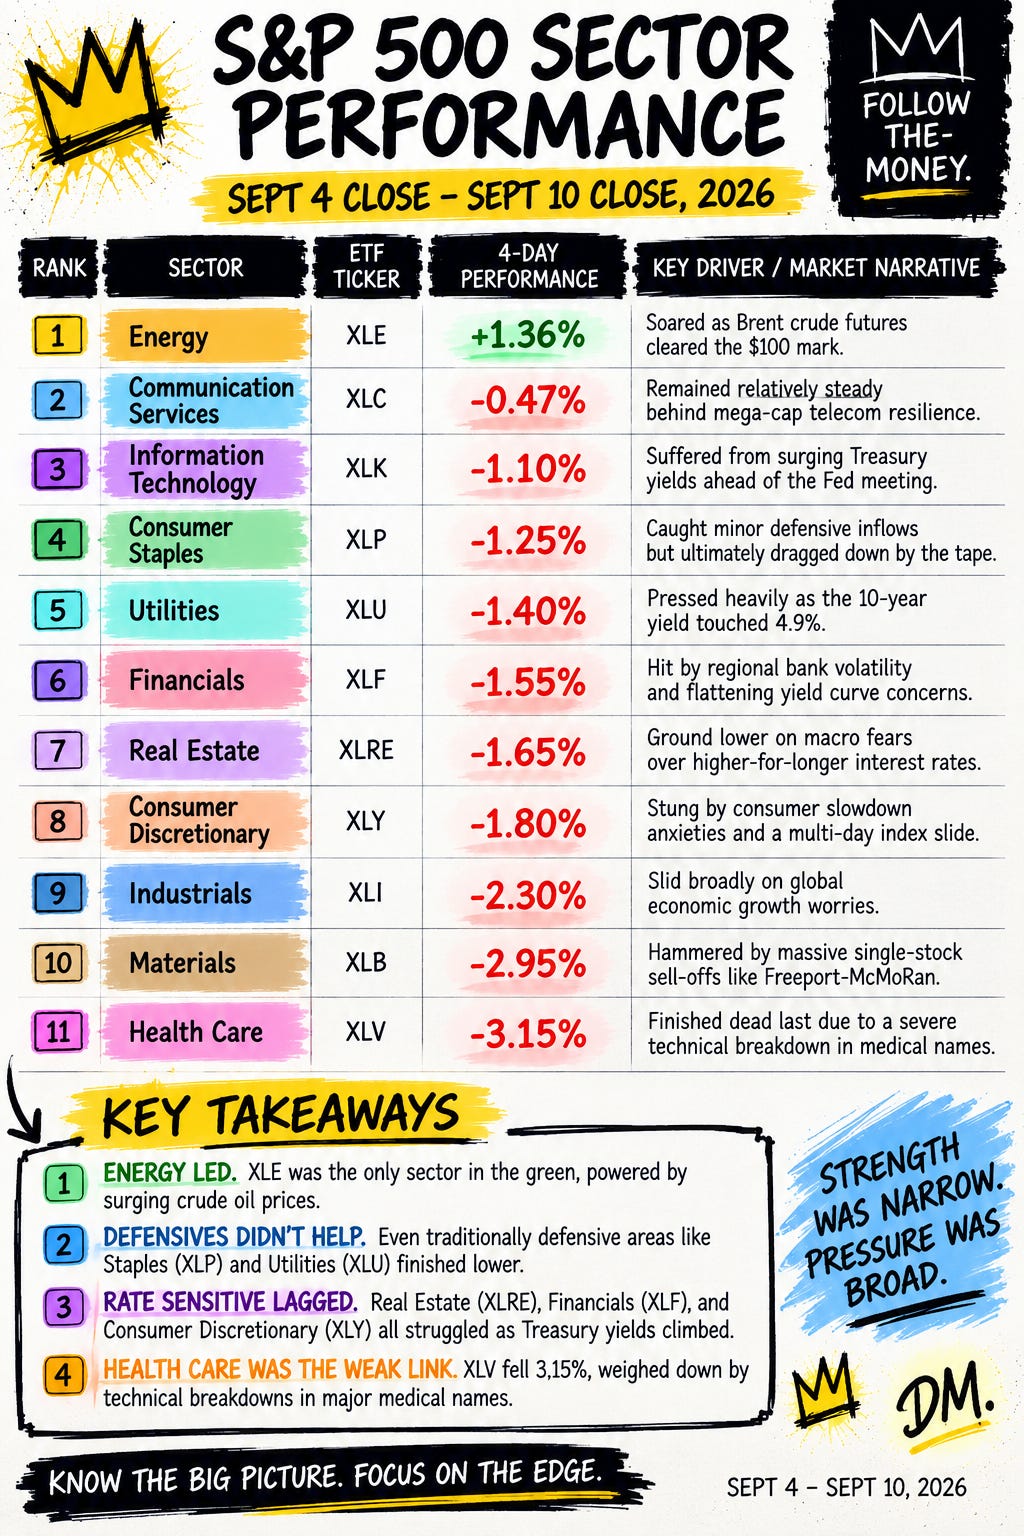
Energy XLE 0.00%↑ was the only S&P 500 sector on my board to finish positive, gaining approximately 1.36%.
No surprise there, but look underneath Energy.
Communication Services XLC 0.00%↑ finished second at approximately -0.47%, followed by Technology at -1.10%.
They were red, but they showed relative strength in a weak market and now the charts are getting more interesting.
XLK is breaking out.
That immediately gets my attention because the strength isn’t isolated to a handful of stocks.
There’s another breakout happening underneath technology in semiconductors.
We’ll get there. XLC is also breaking out.
Unlike XLK, XLC remains below its 200-day SMA, so there’s still work to do, but the direction has changed enough for me to pay attention.
Now flip the board.
Healthcare XLV 0.00%↑ was the weakest sector at approximately -3.15%, followed by Materials XLB 0.00%↑ at -2.95% and Industrials XLI 0.00%↑ at -2.30%.
Healthcare remains on my watchlist.
Industrials are sitting around an important area near the 200-day SMA.
Utilities attempted a breakout, failed, and may be rolling over.
Consumer Discretionary remains below its 200-day SMA.
So yes, we’re seeing strength.
We’re also seeing plenty of cracks.
→ That’s why I don’t want to look at SPY alone and declare the whole market healthy or unhealthy.
The action underneath it matters.
III. Important Secondary Assets & Sectors
Under the hood semiconductors just got interesting.
Now we move from Sector → Industry and this might be my favorite part of the board.
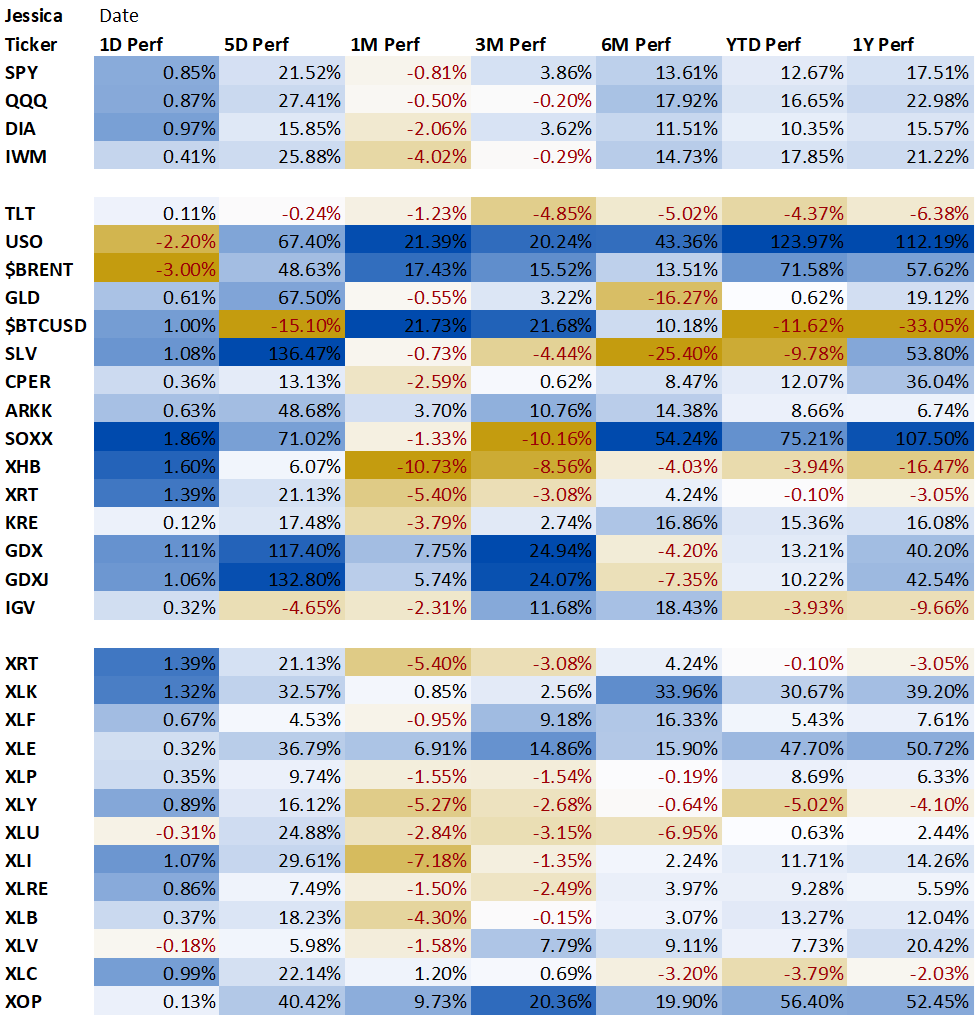
SOXX fell approximately 2.55% during the performance period we’re measuring.
If I only looked at that number, I might assume Semiconductors SOXX 0.00%↑ were weak.
Then, I look at the chart and SOXX is breaking out.
→ That’s an important distinction.
Performance tells me where money has been. Price action helps me figure out where it may be going next.
Technology is showing strength, semiconductors are breaking out underneath it, and several semiconductor stocks I already follow are trading below the fair values I’m using.
Now we have my attention.
Not every loser is a setup.
KRE was hit hard during the week, falling approximately 3.35%, but Regional Banks may be trying to form an accumulation zone.
That’s enough to keep KRE 0.00%↑ on my radar.
Other weak areas aren’t giving me the same setup.
IWM appears to be rolling into a decline.
ARKK may be rolling over.
IGV is showing weakness.
XHB is in a decline and remains below its 200-day SMA.
→ That’s the distinction I care about.
Something being down doesn’t make it cheap and something being cheap doesn’t make it ready.
IV. What Assets & Sectors I’m Watching
Here’s what I’m focused on heading into the new week: