


Welcome back to your weekly market checkup!
I hope you had an amazing week!
ICYMI, you can see the latest Top Pick of the Week here →

A quick highlight from last week →
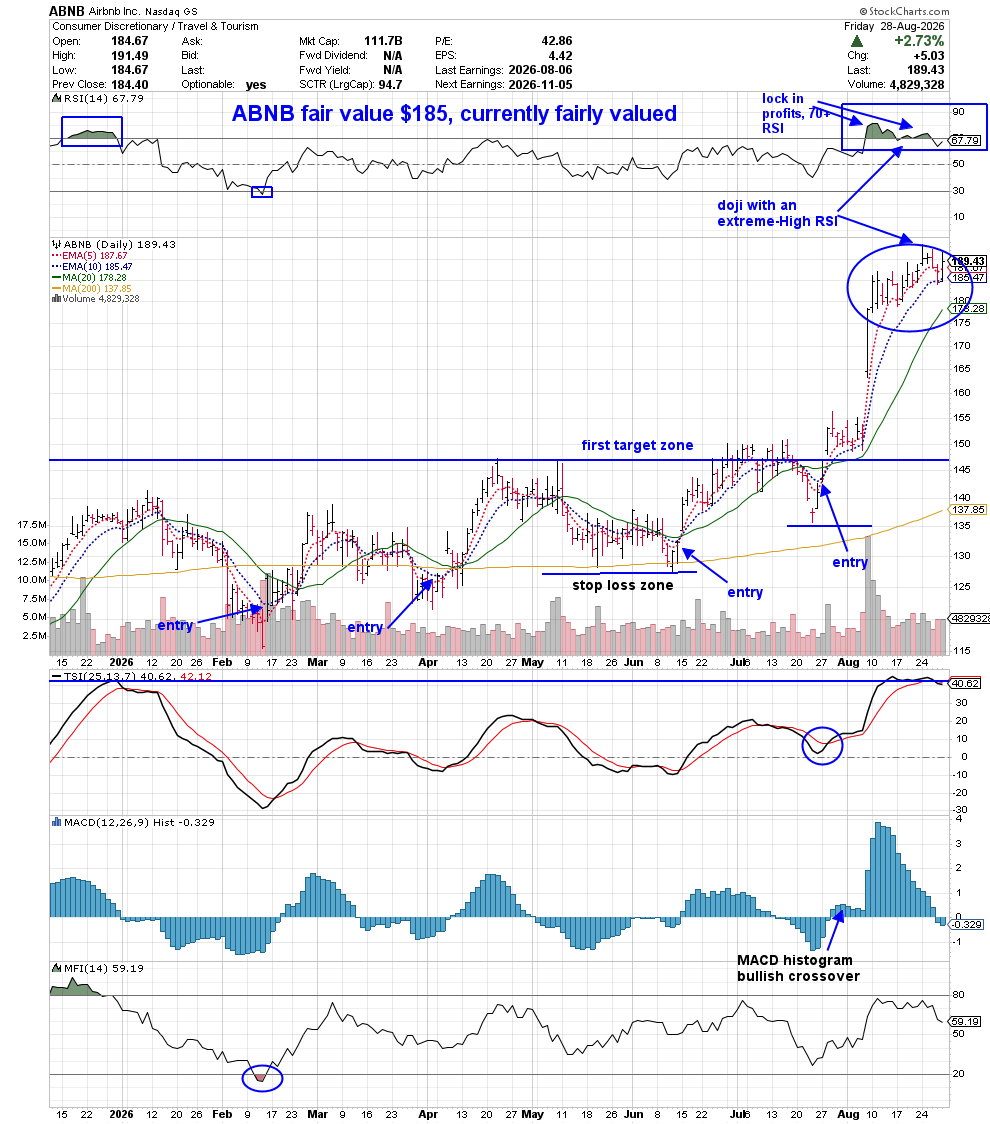
Airbnb Inc. ABNB 0.00%↑ printed a doji bar on Friday and hit an extreme-high RSI reading! This usually signals a top is in and a reversal may be underway here. ABNB was one of our Top Picks of the Week back in June. If this was a swing trade for you, you could close the trade. If this is a position trade, you could lock in some profits and leave the rest to run! ABNB is trading fairly valued here.
Congratulations to you in the ABNB trade!!
Let’s dig into last week’s market recap and the playbook for the week ahead →
The major indexes stabilized this week, but the bigger picture remains mixed.
Bitcoin ($BTCUSD) continues to show the strongest overall momentum. BTC gained 1.38% over the past five days, is back above its 200-day SMA, and is now tagging an extreme-high RSI reading.
The trend is strong, but after the recent run, I’m watching for signs that momentum is becoming stretched.
The S&P 500 SPY 0.00%↑ gained 0.47% and continues to hold its 20-day SMA. That makes SPY the strongest-looking major equity index technically.
The question now is simple: Can buyers keep defending that level?
The Dow Jones DIA 0.00%↑ gained 0.53% and the Nasdaq-100 QQQ 0.00%↑ gained 0.42%, but both closed below their 20-day SMAs. That matters. The indexes finished the week with similar returns, but their technical setups aren’t equally strong.
Meanwhile, long-duration Treasury Bonds TLT 0.00%↑ gained 1.01% and broke above its 20-day SMA. TLT remains below its 200-day SMA, so I’m treating this as an improving short-term setup rather than a confirmed long-term trend change.
The previous strength in hard assets also cooled. Gold GLD 0.00%↑ fell 3.42% after reaching an extreme-high RSI reading and closed Friday back below its 200-day SMA.
Oil USO 0.00%↑ fell 3.67%, giving back some of its breakout momentum, although it remains above its 20-day SMA.
The Bigger Picture
Last week, money was aggressively moving toward Bitcoin, Gold GLD 0.00%↑ , and Oil USO 0.00%↑ .
This week?
That trade cooled.
Bitcoin (BTC) held its leadership, but Gold (GLD) and Oil (USO) pulled back while stocks stabilized and bonds improved.
So I’m heading into the new week watching one thing above everything else:
Do the major indexes hold their short-term support—or does this pause turn into something bigger?
→ The SPY is still holding its 20-day SMA. The DIA and QQQ have already slipped below theirs. That divergence has my attention.
Biggest Takeaway: The major indexes stabilized, but the technical picture is splitting. The SPY is holding its 20-day SMA while the DIA and QQQ closed below theirs, so the question is whether the indexes can defend short-term support.
I. The Market Vitals (Best to Worst)
Here’s how the 7 major asset classes ranked this week:
Bitcoin ($BTCUSD)
Gold GLD 0.00%↑
The S&P 500 SPY 0.00%↑
Oil USO 0.00%↑
The Dow Jones 30 DIA 0.00%↑
The Nasdaq-100 QQQ 0.00%↑
20 Year Bonds Treasury ETF TLT 0.00%↑
♥️Market Pulse: 5/7
5/7 assets are up.
BTC, TLT, DIA, SPY, and QQQ.
GLD, USO are down.
II. Section Rotation (11 SPDR S&P 500 Sectors)
Sector leadership changed this week.
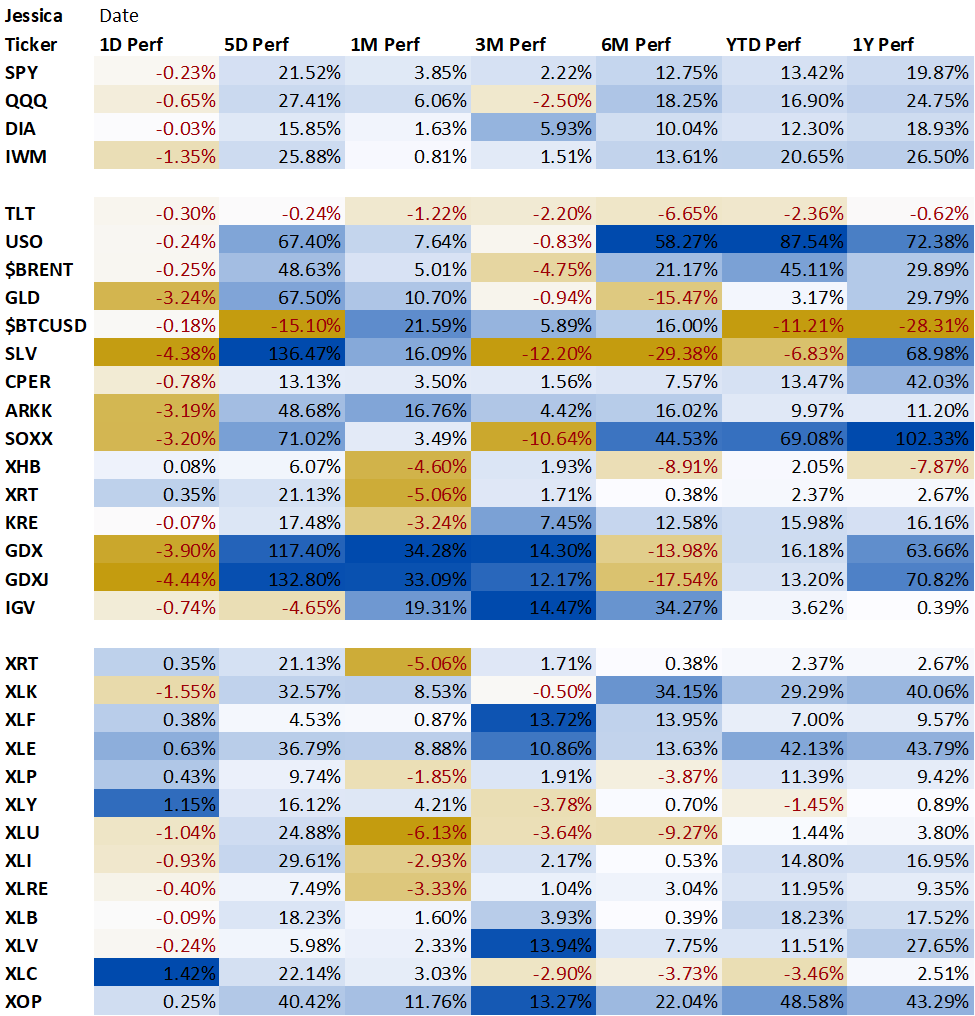
Communication Services XLC 0.00%↑ led the S&P 500 sectors with a +1.43% five-day gain, followed closely by Technology XLK 0.00%↑ at +1.30% and Financials XLF 0.00%↑ +1.08%.
That’s notable because Technology was last week’s weakest sector. It didn’t exactly rip higher, but its return to the top of the rankings tells me growth hasn’t disappeared from this market.
The bigger reversal happened at the bottom.
Healthcare XLV 0.00%↑ fell 1.98%, going from last week’s strongest sector to this week’s weakest. Energy XLE 0.00%↑ also reversed course, falling 1.51% after recently showing strong momentum alongside Oil USO 0.00%↑ .
Industrials XLI 0.00%↑ declined 1.73%, while Real Estate XLRE 0.00%↑ , Consumer Discretionary, Materials, Consumer Staples, and Utilities also finished the five-day period lower.
What This Tells Me
This wasn’t broad sector strength.
Only three of the 11 S&P 500 sectors finished positive over the five-day period: Communication Services XLC 0.00%↑ , Technology XLK 0.00%↑ , and Financials XLK 0.00%↑ and that gives us another piece of the puzzle from Part I.
The SPY held up, but underneath the index, most sectors declined and leadership rotated again.
→ The market is still making progress in places. It just isn’t doing it together.
That’s exactly why I want to see what the specialized ETFs tell us next.
Biggest Takeaway: Participation is narrow and leadership changed again.
III. Important Secondary Assets & Sectors
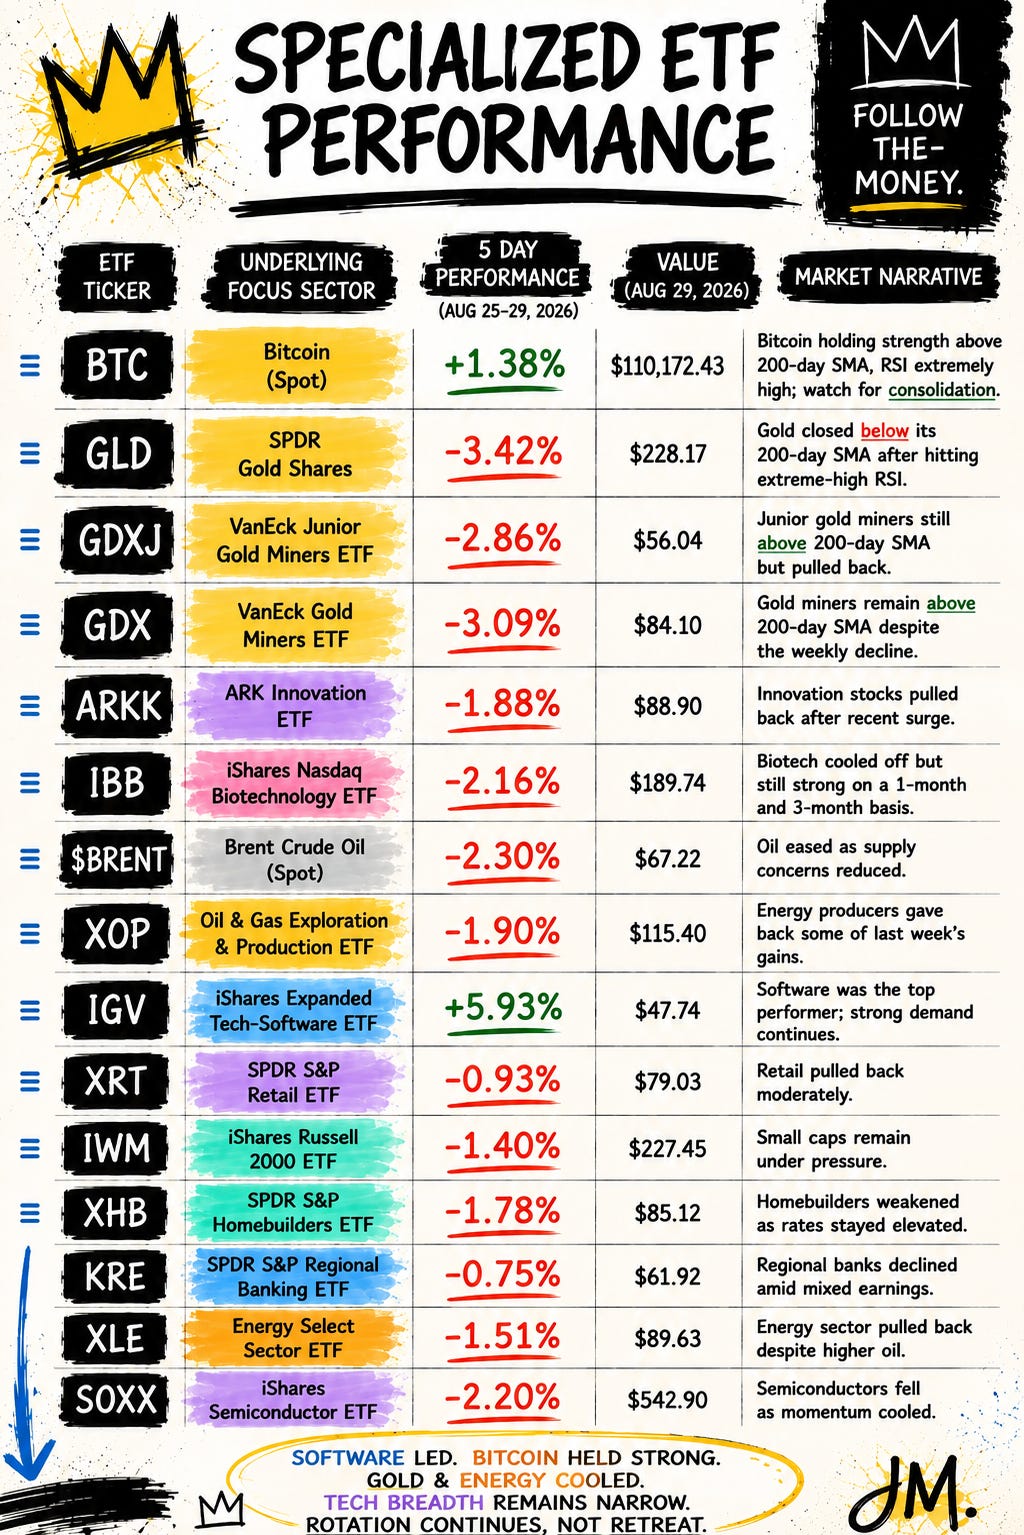
The specialized ETFs tell an even clearer story this week: Software IGV 0.00%↑ stood almost entirely alone.
Software (IGV) gained 5.93%, making it the strongest secondary ETF I track by a wide margin. That fits with Technology XLK 0.00%↑ returning toward the top of the sector rankings, but the strength wasn’t universal across growth.
ARKK fell 1.88% and Semiconductors SOXX 0.00%↑ lost 2.20%.
→ That distinction matters. Money wasn’t simply rushing back into everything growth-related.
Small Caps IWM 0.00%↑ declined 1.40%, while Homebuilders XHB 0.00%↑ fell 1.78% and Regional Banks KRE 0.00%↑ lost 0.75%.
→ That adds to the narrow-participation picture we saw in Part II.
Energy XLE 0.00%↑ / XOP 0.00%↑ also cooled. XOP fell 1.90% and Brent crude ($BRENT) declined 2.30%, confirming some of the momentum loss we saw in USO.
→ However, Gold GLD 0.00%↑ may be the more interesting setup.
Gold (GLD) closed below its 200-day SMA, while Gold Miners GDX 0.00%↑ and Junior Gold Miners GDXJ 0.00%↑ remain above theirs.
GDX fell 3.09% and GDXJ lost 2.86% this week, but both remain up more than 33% over the past month.
→ That’s a divergence I’m watching,
Do the miners eventually follow Gold below their long-term trend. Or does Gold reclaim its 200-day SMA and confirm the miners’ relative strength?
What This Tells Me
The headline is NOT simply that growth returned.
→ Software returned, semiconductors didn’t, growth didn’t, and small caps didn’t.
At the same time, some of the market’s recent leaders, Gold miners, Energy, and Biotech (IBB) pulled back.
That’s a market with pockets of strength, not broad leadership.
→ Going into next week, I care less about finding another winner than seeing which of these moves actually gets confirmed.
Biggest Takeaway: The market is giving us pockets of strength, not broad confirmation.
IV. What Assets & Sectors I’m Watching
Here’s what I’m focused on heading into the new week: