


Welcome back to your weekly market checkup!
I hope you had an amazing week!
ICYMI, you can see the latest Top Pick of the Week here →
Top Pick of the Week: Just Dropped. Is This Trophy Stock Finally on Sale?

I almost picked a company I’d never heard of for this week’s Top Pick.
A quick highlight from last week →
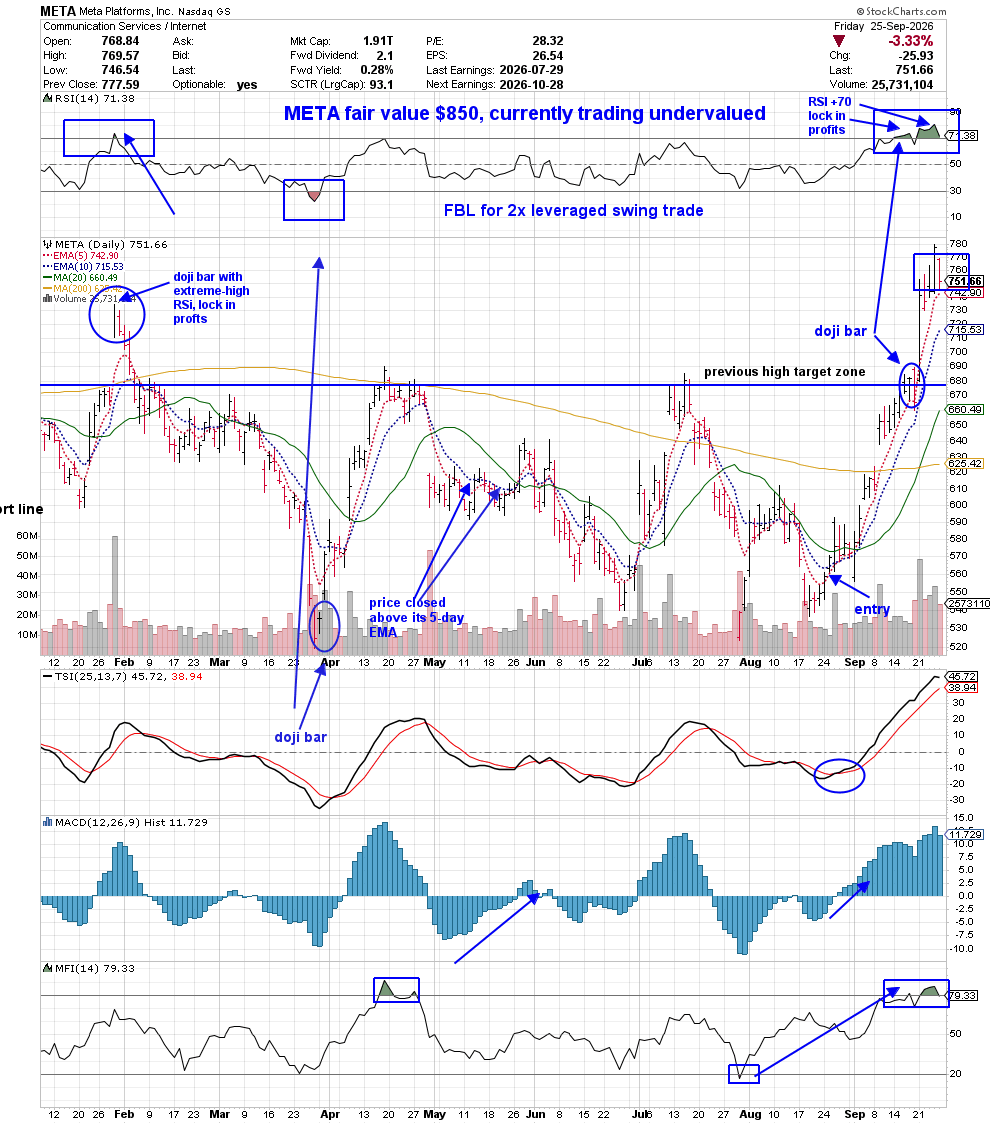
Meta Platforms, Inc. META 0.00%↑ climbed higher and banged an extreme-high RSI reading again giving us a second chance to lock in profits in this trade.
META was one of our Top Picks of the Week back in May. Price is now trading failr valued according to Morningstar. If this was a swing trade for you, you could close the trade.
If this is a position trade, you could lock in profits and leave some to run because you never know how high stocks can go! Remember, don’t cut your winners too short! Lock in profits, but let your winners run.
Congratulations to you in the META / FBL trade!!
Let’s dig into last week’s market recap and the playbook for the week ahead →
The Leaders Are Running. Where’s the Next Setup?
Last week, the winners kept winning.
Technology XLK 0.00%↑ and semiconductors SOXX 0.00%↑ led. Bitcoin (BTC) had a strong week. The Nasdaq QQQ 0.00%↑ , the S&P 500 SPY 0.00%↑ , and the Dow Jones DIA 0.00%↑ all finished green, but underneath the indexes, things weren’t nearly as clean.
Bonds TLT 0.00%↑ struggled. Oil USO 0.00%↑ finished lower. Small caps IWM 0.00%↑ lagged and higher Treasury yields continued to put pressure on rate-sensitive areas of the market.
So heading into this week, I’m not interested in chasing what already ran.
I want to know where the next setup is forming.
I. The Market Vitals
Four of the seven major market assets finished the week green:
Bitcoin → QQQ → SPY → DIA
While: Gold → Oil → TLT finished lower.
Growth was clearly where the strength was.
The QQQ led the major indexes as Technology and semiconductors continued to run. The SPY and the Dow also finished green, while the Russell 2000 IWM 0.00%↑ went the other direction.
That matters because when the major indexes are green, but small caps are still struggling, I’m not going to assume the entire market is participating.
The indexes were green. The strength underneath them was selective.
Bonds: Ugly, But Interesting
TLT was the weakest of my seven major assets last week as Treasury yields moved higher.
Technically, TLT remains in a decline.
So why am I watching it?
The RSI is getting close to an extreme low reading.
That does NOT make TLT a buy. It makes it interesting. There’s a difference.
I want to see the selling exhaust itself and the chart begin to improve before I start talking about an entry.
For now, TLT stays on the radar.
Gold & Silver: Don’t Ignore The Red
Gold finished the week lower and that’s exactly why I’m still watching it.
Gold GLD 0.00%↑ and silver SLV 0.00%↑ remain in their buy zones below their 200-day simple moving averages, which puts both on my opportunity list heading into the week.
That doesn’t mean I buy them simply because they’re down.
I still need my setup.
Gold miners GDX 0.00%↑ are worth watching too. They’re still hanging around their longer-term technical levels, and I want to see whether they can hold.
Last week’s loser can become this week’s opportunity, but the chart still has to earn the trade.
Oil is Sitting on The Line
Oil finished lower, but this chart hasn’t given up yet.
USO USO 0.00%↑ and $BRENT both tested their 20-day simple-moving averages and closed back above them, which is typically bullish.
So this one is simple.
Stay above the 20-day? The consolidation holds.
Break below the 20-day? We move into a decline.
I don’t need to guess which one happens. I’ll let price tell me.
What I’m Taking Into The Week
The strongest areas of the market are already moving.
Semiconductors SOXX 0.00%↑ are running. Technology XLK 0.00%↑ is leading. The QQQ has strength.
Good. Now I want to look somewhere else.
I’m watching the areas that haven’t made their move yet—the charts sitting near important levels, the oversold areas starting to get interesting, and the setups that could give us the next opportunity because finding last week’s winner is easy.
Finding the next one before it runs?
That’s the work. 👑
Here’s how the 7 major asset classes ranked this week
Bitcoin ($BTCUSD)
The Nasdaq-100 QQQ 0.00%↑
The S&P 500 SPY 0.00%↑
Oil USO 0.00%↑
Gold GLD 0.00%↑
The Dow Jones 30 DIA 0.00%↑
20 Year Bonds Treasury ETF TLT 0.00%↑
♥️ Market Pulse: 4/7
4/7 assets are up.
GLD, USO, TLT are down.
BTC, QQQ, SPY, DIA are up.
II. Section Rotation: Technology Takes the Crown 👑
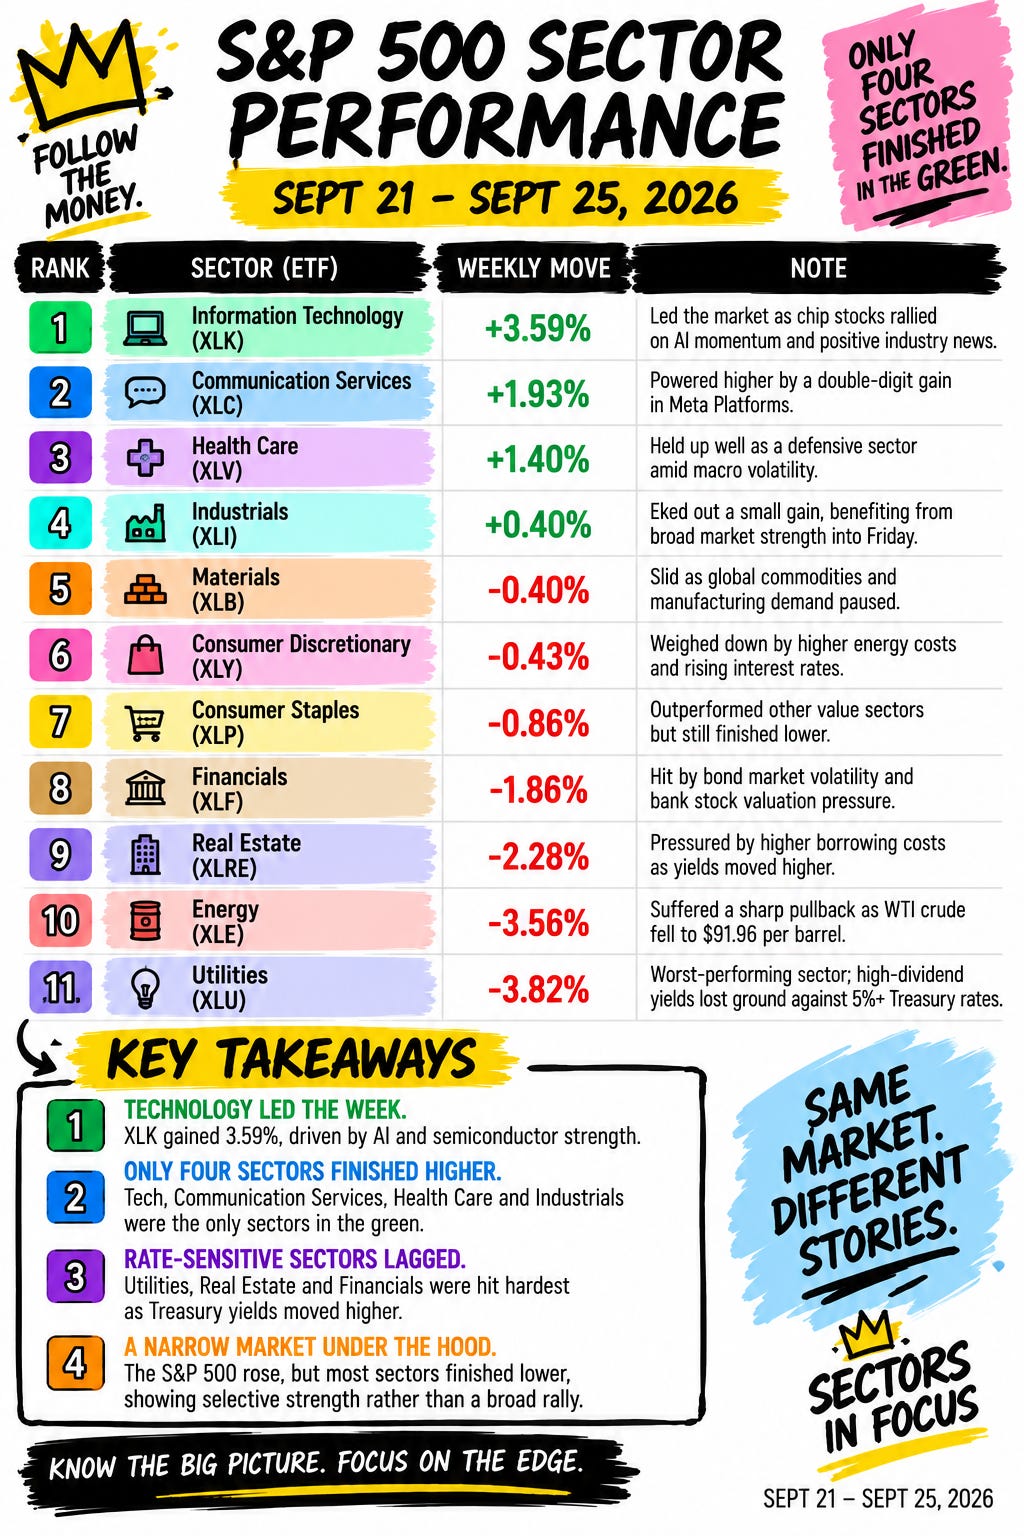
Technology XLK 0.00%↑ was back on top last week.
XLK was the best-performing sector, followed by Communication Services XLC 0.00%↑ and Healthcare XLV 0.00%↑ .
At the bottom?
Utilities, Energy, and Financials.
That’s a pretty wide divide between the leaders and laggards, but I’m not stopping at the top of the leaderboard.
I want to know where the next rotation could be developing.
Technology Is Leading
XLK had the strongest week, with semiconductors adding even more strength underneath the surface.
Communication Services also had a strong week, while Healthcare rounded out the top three.
For now, that’s our leadership: Technology. Communication Services. Healthcare.
I want to see whether they can hold that leadership this week, but some of the charts further down the board are starting to get my attention.
Industrials & Materials Are Setting Up
Industrials are looking interesting on my chart and so are Materials.
Neither led last week. That’s okay.
I’m watching for the setup before it shows up at the top of the performance board.
If Industrials XLI 0.00%↑ and Materials XLB 0.00%↑ begin confirming this week, that would give us something we didn’t have last week: strength spreading into more areas of the market.
That’s what I’m watching for.
Financials Were Weak. I’m Still Watching.
Financials XLF 0.00%↑ finished near the bottom of the sector rankings, but XLF is still on my radar and underneath Financials, I’m watching Regional Banks KRE 0.00%↑ .
KRE finished the week sitting just above its 200-day simple moving average.
That’s an important spot.
Can it hold and more importantly, can it start building a setup from here?
I don’t care that Financials weren’t one of last week’s winners. I care about what they do next.
Utilities & Real Estate Are Getting Stretched
Now let’s go to the ugly side of the board.
Utilities XLU 0.00%↑ were the weakest sector last week, and Real Estate XLRE 0.00%↑ struggled too.
Both XLU and XLRE are at extreme-low RSI readings on my charts.
That gets my attention, but extreme doesn’t mean buy. It tells me the selling is stretched enough that I want these charts on my radar.
Now I wait for price to give me a reason to do something about it.
What I’m Watching for Next
Last week’s leaders are pretty clear: Technology. Communication Services. Healthcare.
Now I’m watching the next group: Industrials. Materials. Financials. Regional Banks.
And sitting over on the oversold watchlist: Utilities and Real Estate.
So here’s the sector question heading into the week:
Does leadership stay concentrated at the top or does the market start handing the baton to someone else?
If rotation starts showing up, I want to see it on the chart before it becomes obvious on the leaderboard. 👑
III. Important Secondary Assets & Sectors
Under The Hood: What’s Running & What’s Setting Up?
Now let’s get underneath the major indexes because this is where the differences start getting interesting.
Some charts have already broken out and others are still sitting there, building.
I want to know which is which.
SOXX: Breakout. Running. 🚀
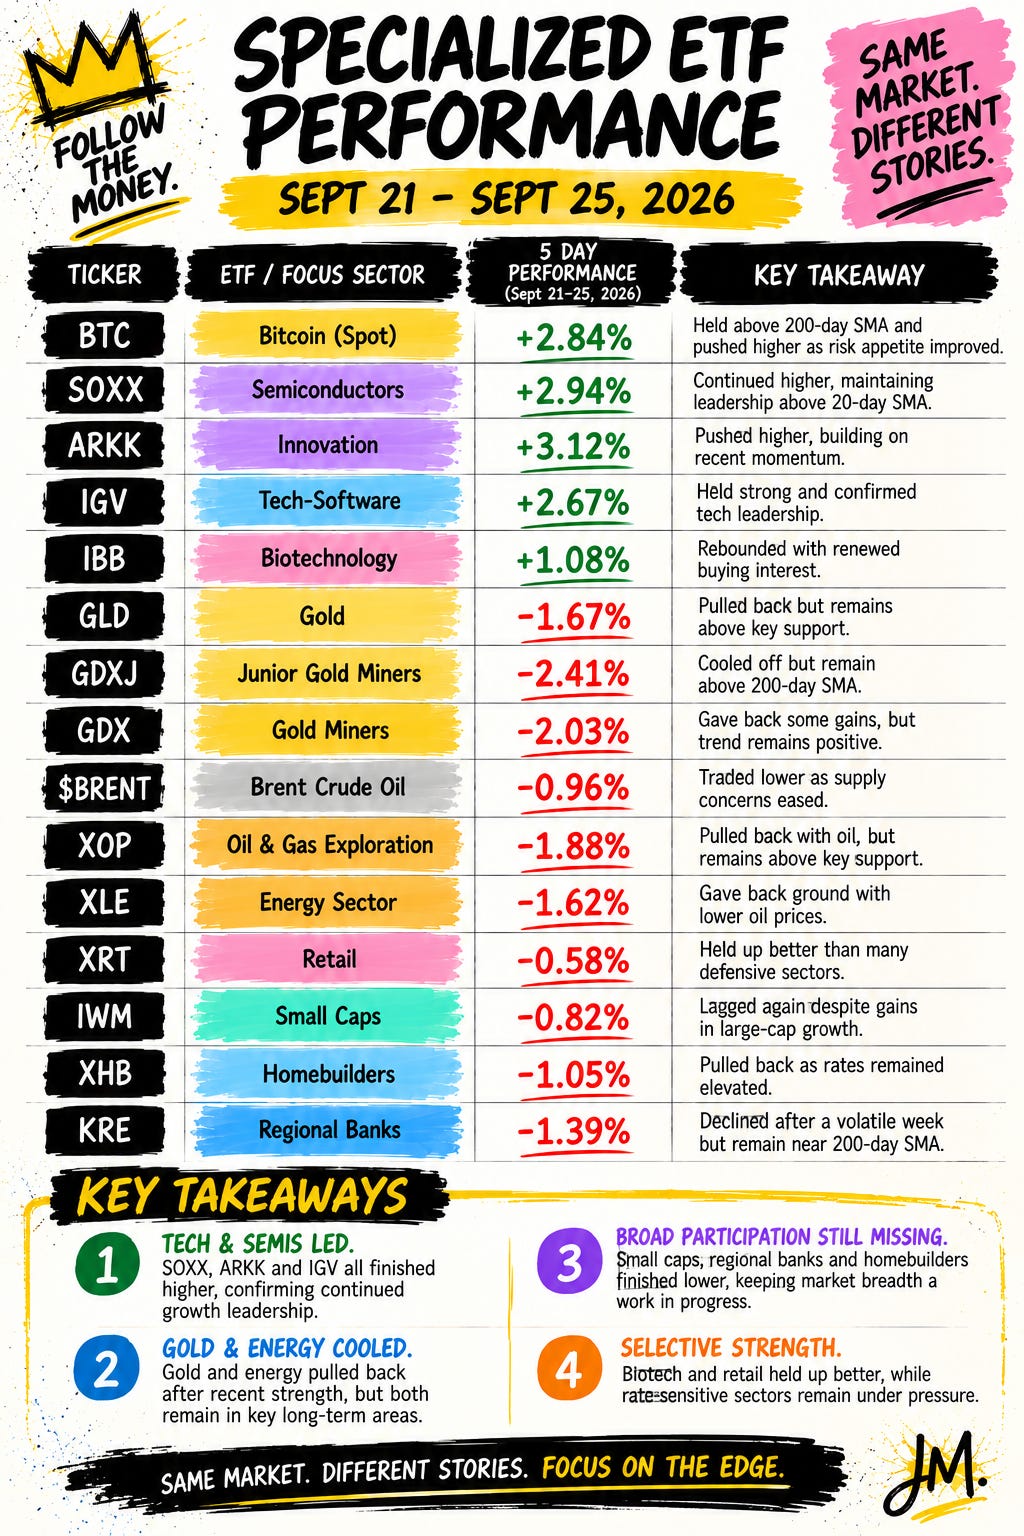
Semiconductors SOXX 0.00%↑ were the strongest area on my secondary ETF board last week and it gave us the technical confirmation too.
SOXX closed above its 20-day simple moving average.
By my rules, that’s a breakout. Now it’s running.
The move already happened, so I’m not treating SOXX like an undiscovered setup.
At this point, it’s a leadership chart.
ARKK & IGV Confirm The Growth Story
SOXX isn’t alone. ARKK also broke above its 20-day SMA and continued higher.
Meanwhile, Software IGV 0.00%↑ remains above its 20-day SMA.
Put those charts together and the message is pretty clear: Growth strength isn’t isolated to semiconductors.
It’s showing up across multiple areas.
SOXX is running. ARKK is running. Software is holding.
Growth ARKK 0.00%↑ has the baton right now.
IWM is still not joining the party, which finished the week red.
That’s a pretty noticeable contrast when QQQ, SPY, and the Dow Jones all finished green.
Big-cap growth is showing strength. Small caps still aren’t giving us the same confirmation.
That doesn’t make IWM uninteresting. Actually, it makes it more important to watch.
If IWM starts participating, that could be another sign that strength is spreading beyond the current leaders.
For now, the divergence remains.
KRE: Now THIS Is Interesting
Regional Banks KRE 0.00%↑ are sitting in a very different position from SOXX.
KRE finished the week just above its 200-day simple moving average.
It hasn’t run and it hasn’t broken out. It’s sitting near an important technical level with the potential to build something from here.
That’s the kind of chart I want on my screen this week.
First, I want to see that 200-day hold. Then I can start looking for my entry setup.
XHB: Keep Homebuilders on The Screen
Homebuilders XHB 0.00%↑ is another chart I’m keeping close this week.
Homebuilders haven’t made the kind of move we’re seeing in semiconductors or growth.
Instead, the setup is still developing and with Treasury yields moving sharply, I want to see how Homebuilders respond rather than assume higher rates automatically decide the trade for me.
Price gets the final vote. If the chart gives me confirmation, then we have something to work with.
Until then, it stays on the watchlist.
The Under-The-Hood Scan
Here’s how I’m separating these charts heading into the week:
ALREADY RUNNING
SOXX — Breakout
ARKK — Breakout
IGV — Holding above the 20-day SMA
STILL DEVELOPING
KRE — Holding above the 200-day SMA
XHB — Setup developing
IWM — Still lagging
And that’s the part of this market I find most interesting right now.
I already know semiconductors are strong.
The chart told us.
Now I want to see which chart speaks up next. 👑
IV. Where I'm Looking Next
So…Where Could the Next Setup Come From?
My process stays the same: We know what’s already running.