


Welcome back to your weekly market checkup!
I hope you had a great week!
ICYMI, you can see the latest Top Pick of the Week here →
Top Pick of the Week: A Rare Bright Spot in a Weak Market

Sometimes the best trade is the one you don’t take.
A quick highlight from last week →
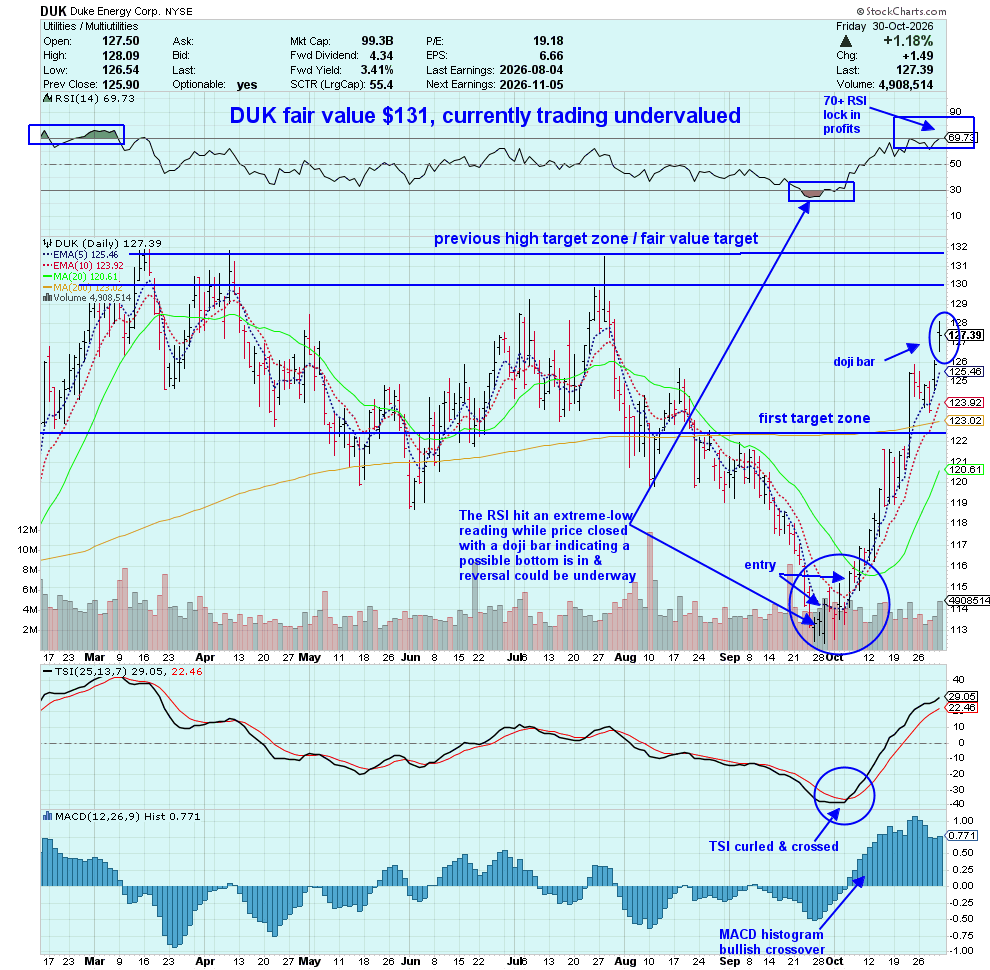
DUK was one of our Top Picks of the Week back on September 30, 2026, and it has now reached two of our targets: the 200-day SMA and an extreme-high RSI reading! This is our second profit-taking opportunity here. Now the focus shifts to managing the trade.
For swing traders: With the first target reached, this is a good time to review your exit plan and consider taking profits. I’m also watching the RSI for an extreme-high reading that could signal stretched momentum.
For position traders: Taking partial profits near the first target while keeping a portion for a potential move toward fair value is another approach, provided the longer-term thesis remains intact.
Remember: Don’t cut your winners too short, but don’t ignore your exit plan either. Let your strategy, not your emotions, decide when to ring the register. Congratulations to you in the DUK trade! 🎉
Let’s dig into last week’s market recap and the playbook for the week ahead →
Oil & Treasuries Lead While Technology Lags
Last week’s asset-class rankings tell us something important about the market heading into November.
USO finished first, followed by TLT, SPY, DIA, QQQ, Bitcoin, and GLD.
What caught my attention wasn’t simply who led. It was who fell behind.
The QQQ underperformed both SPY and DIA, consistent with the pressure we saw in technology stocks following the negative earnings reactions from Intel and Alphabet.
And that raises an important question.
Are investors becoming less willing to pay for AI growth when the cost of building that growth keeps rising?
Alphabet’s GOOGL 0.00%↑ earnings put that concern front and center. Despite strong Google Cloud growth, investors reacted negatively to the company’s massive capital spending and cash-flow outlook.
Meanwhile, TLT’s second-place finish deserves attention. Strength in long-term Treasuries could reflect changing interest-rate expectations or a more cautious market environment, but we’ll need to see whether that leadership continues.
And then there’s Gold GLD 0.00%↑ .
GLD finished last, complicating the idea that investors were moving uniformly toward traditional defensive assets.
Here’s how the 7 major asset classes ranked this week
Oil USO 0.00%↑
20 Year Bonds Treasury ETF TLT 0.00%↑
The Dow Jones 30 DIA 0.00%↑
The S&P 500 SPY 0.00%↑
The Nasdaq-100 QQQ 0.00%↑
Bitcoin ($BTCUSD)
Gold GLD 0.00%↑
♥️ Market Pulse: 1/7
1/7 assets are up.
TLT is up.
USO, BTC, GLD, DIA, SPY, QQQ are down.
👑 What I’m Watching This Week
I’m watching whether USO and TLT maintain their leadership, whether QQQ can stabilize, and whether SPY and DIA continue outperforming technology-heavy stocks.
The sector charts should help us determine whether last week’s weakness was concentrated in technology or spreading into other areas of the market.
For now leadership is selective and I’m not treating every pullback as a buying opportunity.
II. Section Rotation
Last week’s sector rankings revealed a sharp contrast beneath the broader market.
Healthcare XLV 0.00%↑ finished first, followed by Materials XLB 0.00%↑ and Utilities XLU 0.00%↑ .
Meanwhile, Technology XLK 0.00%↑ ranked 10th, and Communication Services XLC 0.00%↑ finished last.
That puts Healthcare and Utilities near the top while two sectors heavily exposed to major technology companies lagged, but the charts tell us something the rankings alone can’t.
Strong Sectors. Stretched Momentum.
The XLV and XLB are showing extreme-high RSI readings.
The XLU, our third-ranked sector, is also approaching extreme momentum levels and formed a doji Friday.
That doji signals indecision, not a confirmed reversal. But combined with elevated RSI, it’s worth watching whether Utilities continues higher or begins consolidating.
Here’s the distinction: A strong sector isn’t automatically a good entry.
I’m watching for pullbacks, consolidation, or renewed technical confirmation before considering positions in these leaders.
The Center of the Market
Consumer Discretionary XLY 0.00%↑ , Industrials XLI 0.00%↑ , Real Estate XLRE 0.00%↑ , Consumer Staples XLP 0.00%↑ , Financials XLF 0.00%↑ , and Energy XLE 0.00%↑ occupied the center of the rankings.
Industrials XLI 0.00%↑ finished fifth, Real Estate XLRE 0.00%↑ , and Financials XLF 0.00%↑ eighth.
These sectors give us a useful comparison group, but their rankings alone don’t establish attractive entry setups.
I’ll need to see price structure, momentum, and nearby resistance before deciding which deserves a closer look.
The Weakest Links: The XLK & XLC
Technology XLK 0.00%↑ finished second to last, while Communication Services XLC 0.00%↑ ranked last.
The XLC’s technical condition is especially concerning.
Its RSI is at an extreme-low reading and price is below its 200-day SMA.
That’s a warning that selling pressure has been substantial.
An oversold reading doesn’t guarantee a rebound.
I’d want to see the XLC reclaim its short-term moving averages and show improving momentum before becoming more constructive. Its 200-day SMA would remain a bigger test.
Interestingly, Verizon VZ 0.00%↑ gained 2.45% Friday despite the weakness in Communication Services.
That’s the kind of stock-level relative strength I’m watching, although one strong session doesn’t confirm a lasting recovery.
My Sector Takeaway
The strongest sectors are extended and the weakest are showing technical damage.
That leaves me watching for better entries in the leaders and evidence of stabilization in the laggards.
I’m also keeping an eye on the middle-ranked sectors for setups that may develop as the week progresses.
Last week’s winners aren’t automatically this week’s best buys.
III. Important Secondary Assets & Industries: Biotechnology Leads. Software Sinks. Semiconductors Lose Support.
Last week’s industry-group rankings revealed a clear divide beneath the broader market.
Biotechnology IBB 0.00%↑ led with a 4.75% gain, followed by Homebuilders (XHB), up 2.63%, and Small Caps (IWM), up 1.30%.
At the other end, Software (IGV) fell 5.70%, while Semiconductors (SOXX) delivered a warning that caught my attention: a close below its 200-day simple moving average.
Those are two different kinds of weakness. And both matter heading into November.
Biotechnology Takes the Lead
Biotechnology’s first-place finish reinforces what we saw in Part 2, where Healthcare XLV 0.00%↑ ranked first among the 11 sectors.
When a sector and one of its major industry groups are both leading, I pay attention.
I’ll be watching whether the IBB can maintain that relative strength and whether its price action offers a reasonable entry rather than an extended move to chase.
Strength wasn’t limited to Healthcare either.
Homebuilders gained 2.63%, Small Caps rose 1.30%, and Retail XRT 0.00%↑ gained 1.22%.
That tells me technology weakness wasn’t a market-wide retreat. Some economically sensitive areas continued to hold up.
Software: AI’s Next Big Question
The IGV lost 5.70% over the five trading days ending October 30, making it the weakest-performing ETF in our industry-group comparison.
And there’s a fundamental question behind the selling that I don’t want to ignore.
What happens to established software companies if AI agents begin doing work their customers currently pay subscriptions to perform?
That’s a potential threat to pricing power and recurring revenue, but I don’t believe every software company faces the same risk. Some may use AI to strengthen their products and customer relationships, while others could find their existing services harder to defend.
It’s too early to know how that divide will play out.
For now, the IGV’s price action is telling me to be cautious.
I’m watching for stabilization, improving momentum, and a recovery of key moving averages before becoming more constructive.
Semiconductors: The 200-Day SMA Warning
The SOXX declined 1.40% for the week, a smaller five-day loss than the IGV, but Friday told a more concerning technical story.
The SOXX fell sharply and closed below its 200-day SMA.
That’s a level I take seriously when evaluating the longer-term trend.
One close below it doesn’t confirm a prolonged downtrend, but it changes what I need to see next.
Can SOXX reclaim its 200-day SMA or will that moving average begin acting as resistance?
Intel’s INTC 0.00%↑ reported guidance disappointment adds context to the pressure on chip stocks. Still, semiconductor companies face different demand drivers, and higher memory costs can help some businesses while hurting others.
I don’t want to treat the entire industry as one trade.
The broader technical signal is what matters most right now: SOXX has lost a major reference level and buyers need to show they can recover it.
👑 What I’m Watching This Week
The contrast is clear.
Biotechnology IBB 0.00%↑ is leading, Software IGV 0.00%↑ is struggling, and Semiconductors SOXX 0.00%↑ have support to reclaim.
I’ll be watching whether the IBB maintains its relative strength, whether the IGV begins stabilizing, and whether the SOXX can recover its 200-day SMA.
Homebuilders XHB 0.00%↑ and Small Caps IWM 0.00%↑ also stay on my radar after their positive weekly performance.
I’m not assuming the weakest industry is the next buying opportunity. I’d rather follow the evidence than try to catch the bottom.
👑 WANT TO KEEP READING?
This is where the free preview ends, but the Sunday Market Playbook keeps going.
Become a paid subscriber to unlock the full Playbook, plus my Wednesday Top Pick of the Week and everything else I’m researching and watching.
Unlock the rest of the Playbook and come join us. 👑