


Welcome back to your weekly market checkup!
I hope you had a great week!
ICYMI, you can see the latest Top Pick of the Week here →
Top Pick of the Week: Google Again? Yep. And That’s Exactly the Point.

Alphabet Inc. was our Top Pick of the Week on June 17th and here we are in October and GOOGL is back.
A quick highlight from last week →
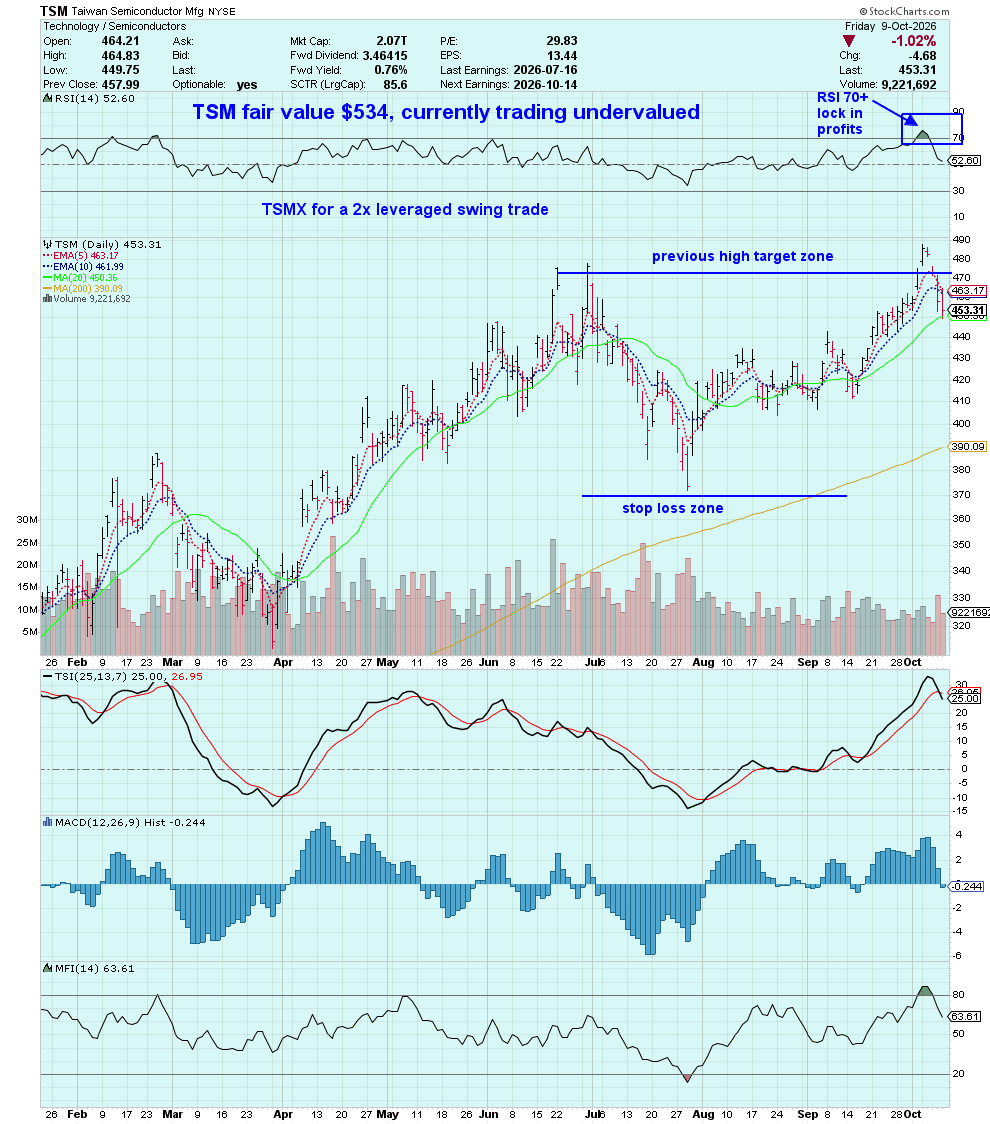
Taiwan Semiconductor Mfg TSM 0.00%↑ hit an extreme-high RSI reading and blew through its previous high target zone again on Monday signaling it’s time to lock in some profits here!! TSM was one of our Top Picks of the Week back on 9/9/26.
Price is still trading undervalued here according to Morningstar. If this was simply a swing trade for you, you could close the trade. If this is a position trade, you could lock in profits and leave some to run because TSM is still undervalued and you also never know how high stocks can go!
Remember, don’t cut your winners too short! Lock in profits, but let your winners run. Congratulations to you in the TSM / TSMX trade!!
Let’s dig into last week’s market recap and the playbook for the week ahead →
👑 BEFORE WE GET INTO THE PLAYBOOK...
For the month of October, you can get 22% off an annual Nurse in the Market subscription.
Paid subscribers get the full Sunday Market Playbook every week, plus my Wednesday Top Pick of the Week and the research and trade ideas I’m watching along the way.
You can start today’s Playbook for free, but the full post is for paid subscribers.
So if you’ve been hanging out on the free side waiting for a reason to join us...
22% off. October only. Come join us. 👑
New Highs. New Leaders. Now Show Me The Setups.
The indexes are making records, but the action underneath is changing.
I’m watching which sectors are gaining strength, which former leaders can hold support, and where the next setups might develop.
The market made new highs this week, but technology wasn’t doing all the heavy lifting.
Utilities, consumer staples, and energy showed strength while parts of the technology trade came under pressure and the equal-weight S&P 500 outperformed the traditional cap-weighted index for the first time in seven weeks.
→ That’s enough to get my attention, but is this a real shift in leadership—or just a breather for the usual suspects? 👀
I’m not making that call based on one week. I’m going to the charts.
I. The Market Vitals
My Friday notes showed six of seven major asset classes green, with Bitcoin (BTC) the exception.
That’s a constructive backdrop, but the individual charts were telling different stories.
SOXX: Semiconductors
My note was simple: Might roll over. Holding the 20-day SMA.
After the selling pressure in semiconductors, that 20-day SMA is the level I’m watching.
A hold would give the group a chance to stabilize. A break below it would tell me the technical picture is weakening.
For now, I’m watching support rather than assuming the next move.
IWM: Small Caps
IWM tested its 200-day SMA and closed above it.
That’s encouraging, but I’d like to see additional closes above that level and stronger price action around the 5-day EMA.
One good close gets IWM on my radar. Follow-through keeps it there.
DIA: The Dow Jones
DIA reclaimed its 200-day SMA and finished Friday above it.
That’s an improvement in the longer-term technical picture, but I’m not calling it a fresh breakout based on the 200-day SMA alone.
I want to see whether buyers can build on that move.
The Question Underneath The Highs
The indexes may be making records, but the opportunity isn’t evenly distributed.
Semiconductors SOXX 0.00%↑ are testing support. Small caps IWM 0.00%↑ and the Dow Jones DIA 0.00%↑ are working to establish stronger technical footing. And some of the sectors that haven’t been leading are starting to get my attention.
Is money rotating into new leadership?
Possibly, but I’m not confusing a strong week with a confirmed trend.
Nine of eleven SPDR sectors were green and the differences between those charts matter more to me than the headline index level because the next opportunity might not be in the stock everybody’s already talking about.
It might be sitting in a sector that’s quietly improving while nobody’s paying attention.
Here’s how the 7 major asset classes ranked this week
The Nasdaq-100 QQQ 0.00%↑
The S&P 500 SPY 0.00%↑
The Dow Jones 30 DIA 0.00%↑
Bitcoin ($BTCUSD)
Oil USO 0.00%↑
Gold GLD 0.00%↑
20 Year Bonds Treasury ETF TLT 0.00%↑
♥️ Market Pulse: 2/7
6/7 assets are up.
GLD, SPY, QQQ, DIA, USO, TLT are up.
BTC is down.
New highs are the headline. The setups underneath are where the work begins and this week’s sector board has plenty to say. 👑
II. Section Rotation
Utilities XLU 0.00%↑ , Energy XLE 0.00%↑ , and Consumer Staples XLP 0.00%↑ led my five-day sector rankings. Technology XLK 0.00%↑ and industrials XLI 0.00%↑ lagged, but the charts tell me more than the rankings.
XLU: Utilities Already Running
XLU gained 3.97% over five days and broke out above its 20-day SMA.
It’s running, with price above its 5-day and 10-day EMAs, but the 200-day SMA is still overhead.
I’m watching how XLU handles that potential resistance—not chasing the move after a strong week.
XLP: Consumer Staples Breakout Confirmed
XLP gained 3.60%, breaking out above its 20-day SMA and pushing through its 200-day SMA.
That’s a meaningful improvement in the technical picture.
Now I want to see those levels hold. A breakout is one thing. Staying above it is another.
XLF: Financials Setting Up
XLF gained 2.32% and is recovering above its 200-day SMA, but it hasn’t closed above its 20-day SMA.
That’s my breakout trigger.
With major bank earnings starting Tuesday, this is one of the more interesting setups on my board.
I’ll let the earnings reaction and price action make the decision.
XLRE: Real Estate Early Recovery
XLRE gained 1.96% and is bouncing from its recent decline.
The RSI is recovering, and the MACD histogram is improving. But price remains below its 20-day and 200-day SMAs.
Encouraging? Yes. A confirmed breakout? Not yet.
Elsewhere On The Board
Energy (XLE) was another strong performer, while healthcare (XLV) showed strength worth monitoring.
Technology (XLK) and industrials (XLI) were the week’s sector laggards.
My Takeaway
XLU is running. XLP has broken out. XLF is approaching its trigger. XLRE is trying to recover.
Four charts. Four different decisions.
→ That’s why I look at the setup before I look at the ticker.
Now let’s see which individual stocks are earning a spot on my board. 👑
III. Important Secondary Assets & Industries
The sector rankings only tell part of the story. The industry ETFs show where the differences get interesting.
IGV vs. SOXX: A Tale of Two Technology Trades
Software (IGV) led my secondary asset rankings, gaining 3.91% over five days.
Semiconductors (SOXX) went the other direction, losing 5.01%.
That’s an 8.92-percentage-point gap between two major technology groups.
Over the past month, IGV gained 10.65%, while SOXX gained 5.22%.
Technology isn’t moving as one trade.
Software has the stronger short-term momentum. Meanwhile, SOXX is testing its 20-day SMA after a difficult week.
I’m watching whether semiconductor buyers defend that level or whether software continues to pull ahead.
XLF vs. KRE: The Banking Split
Financials (XLF) gained 2.32% over five days and are approaching a potential breakout above the 20-day SMA.
Regional banks (KRE) lost 2.50%.
That’s a 4.82-percentage-point difference within the broader financial trade and with major bank earnings beginning Tuesday, that divergence deserves attention.
The big financial picture is improving. Regional banks haven’t joined the party.
I’ll be watching whether earnings bring buyers into KRE or widen the gap.
Elsewhere On My Board
Energy exploration and production (XOP) gained 3.56%, supporting the strength I saw in the broader energy sector.
Gold miners (GDX) rose 1.71%, while junior miners (GDXJ) gained 0.69%. Both remain sharply lower over the past month.
Homebuilders (XHB) fell 2.00%, another reminder that strength isn’t spreading evenly.
From Industry To Stock
The strongest sector doesn’t always contain the strongest industry. And the strongest industry doesn’t automatically give me a trade.
→ That’s why I work from the market down to the individual stock.
Now let’s get to the names on my board. 👑
👑 WANT TO KEEP READING?
This is where the free preview ends, but the Sunday Market Playbook keeps going.
Become a paid subscriber to unlock the full Playbook, plus my Wednesday Top Pick of the Week and everything else I’m researching and watching.
And for October, the annual subscription is 22% off.
Unlock the rest of the Playbook and come join us. 👑