


Welcome back to your weekly market checkup!
I hope you had an awesome week!
ICYMI, you can see the latest Top Pick of the Week here →

A quick highlight from last week →
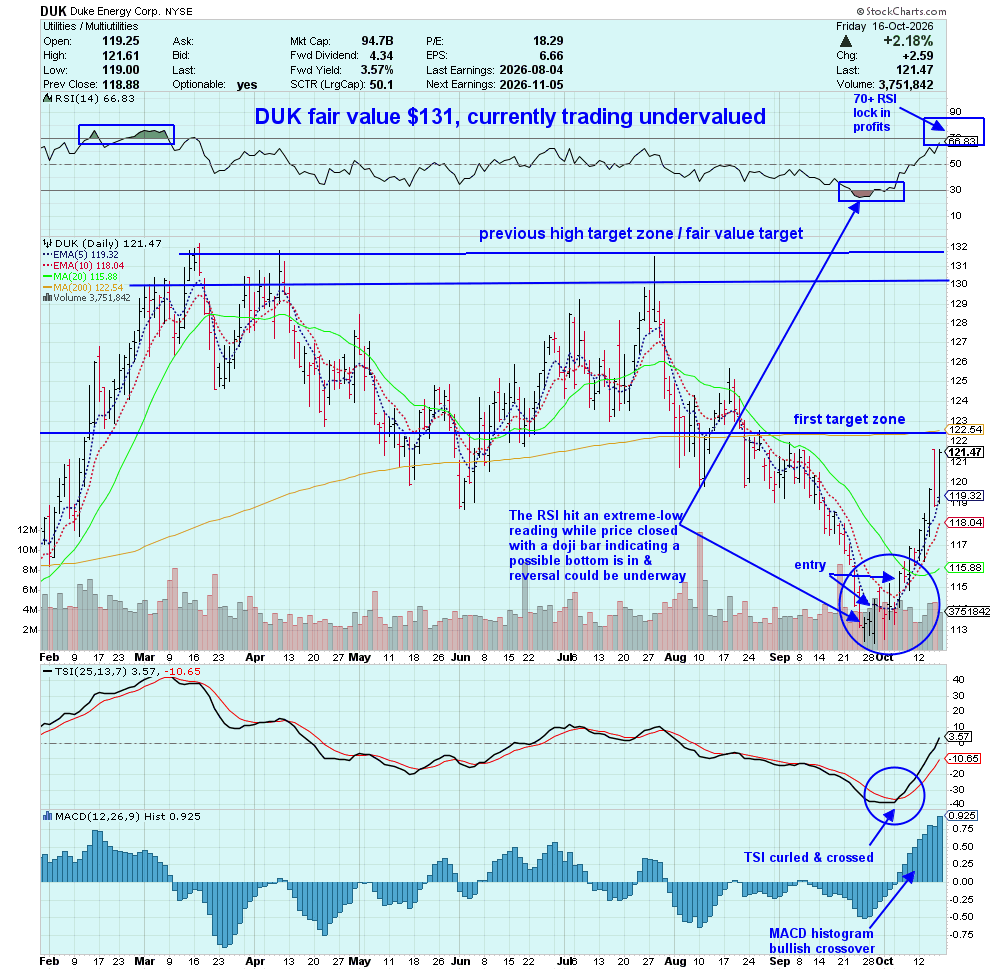
Duke Energy Corp. DUK 0.00%↑ is on the move and price is approaching its first target, the 200-day SMA, with RSI climbing to 66.
DUK was one of our Top Picks of the Week back on September 30, 2026, and now it’s time to start thinking about our exit strategy.
For swing traders: Price hasn’t reached the 200-day SMA or an extreme-high RSI reading yet. I’m watching for those signals before considering taking profits.
For position traders: You may choose to take partial profits near the first target while keeping a portion of the position for a potential move toward fair value and beyond.
Remember: Don’t cut your winners too short. Lock in profits when your plan calls for it, but give your winners room to run.
👑 BEFORE WE GET INTO THE PLAYBOOK...
For the month of October, you can get 22% off an annual Nurse in the Market subscription.
Paid subscribers get the full Sunday Market Playbook every week, plus my Wednesday Top Pick of the Week and the research and trade ideas I’m watching along the way.
You can start today’s Playbook for free, but the full post is for paid subscribers.
So if you’ve been hanging out on the free side waiting for a reason to join us...
22% off. October only. Come join us. 👑
Let’s dig into last week’s market recap and the playbook for the week ahead →

Oil is Running, Tech is Struggling. What’s Next?
Last week, the market told two different stories.
Oil USO 0.00%↑ led the seven assets I track, followed by bonds TLT 0.00%↑ and the Dow Jones DIA 0.00%↑ , while the S&P 500 SPY 0.00%↑ and the Nasdaq QQQ 0.00%↑ struggled.
The DIA held its breakout and 5-day EMA, but the SPY and the QQQ fell below their 20-day SMAs. The QQQ took the harder hit, with the QQQ’s RSI reading approaching oversold territory.
The selloff in AI and semiconductor stocks raised fresh questions about the debt financing behind the AI buildout, even as major chip suppliers reported strong demand.
Meanwhile, the USO surged, TLT broke out below its 200-day SMA, and gold GLD 0.00%↑ began forming an accumulation setup. Bitcoin (BTC) remained under pressure, leaving me watching whether it stabilizes or continues lower.
My focus for the week ahead: Can the DIA maintain its strength while the SPY and QQQ find support? And will money continue moving toward oil and bonds, or return to growth?
The market isn’t moving together and that’s exactly why I’m watching where the money goes next.
I. The Market Vitals
Here’s how the 7 major asset classes ranked this week
Oil USO 0.00%↑
20 Year Bonds Treasury ETF TLT 0.00%↑
The Dow Jones 30 DIA 0.00%↑
Gold GLD 0.00%↑
Bitcoin ($BTCUSD)
The S&P 500 SPY 0.00%↑
The Nasdaq-100 QQQ 0.00%↑
♥️ Market Pulse: 3/7
3/7 assets are up.
DIA, USO, TLT are up.
BTC, GLD, SPY, QQQ are down.
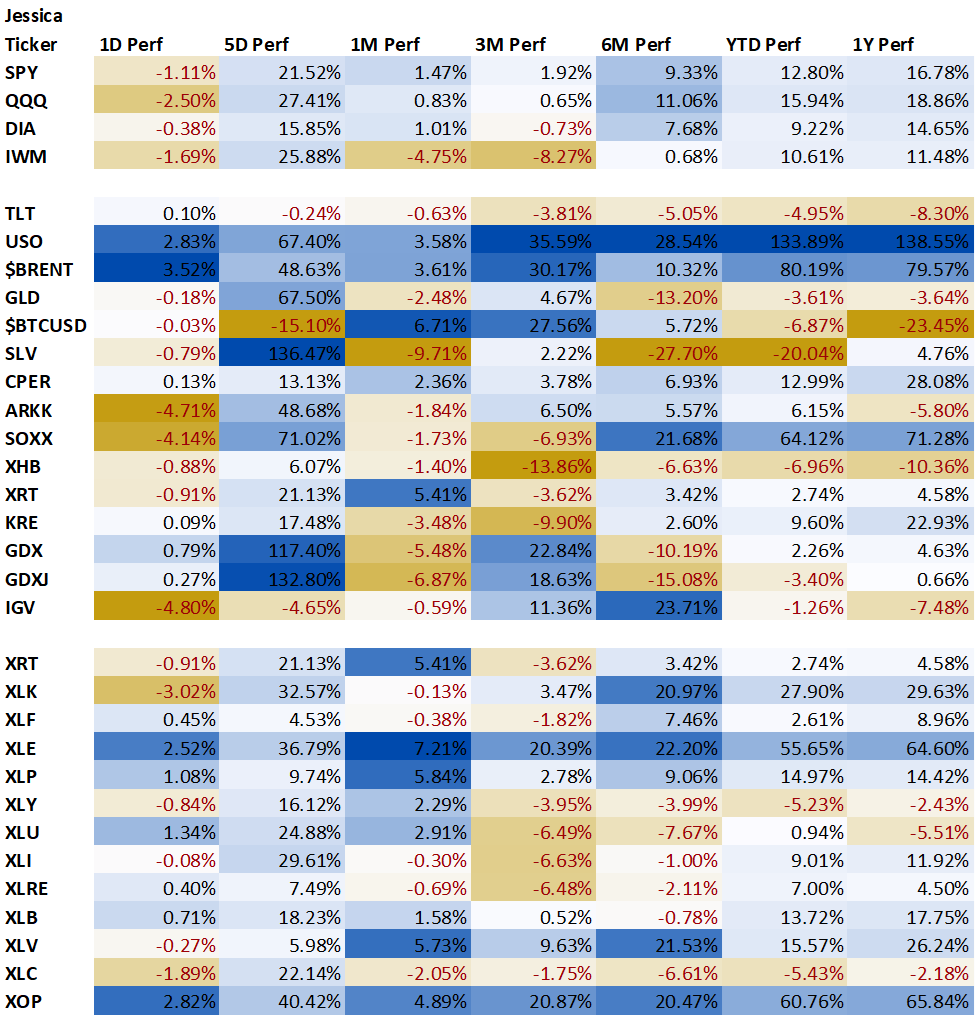
II. Section Rotation
Seven of the 11 S&P 500 sectors finished higher last week, led by Consumer Staples XLP 0.00%↑ +5.02%, Energy XLE 0.00%↑ +4.86%, and Healthcare XLV 0.00%↑ +3.45%.
Technology XLK 0.00%↑ was the clear laggard at −7.70%.
The XLP continued its breakout above the 200-day SMA, but the RSI reading reached 73. The strength is undeniable. So is the risk of chasing an extended move.
The XLE followed oil higher, trading well above its 200-day SMA with RSI near 70. Momentum remains strong, but I’d rather watch for a pullback than chase the rally.
Materials XLB 0.00%↑ gained 3.01% and is developing an interesting recovery setup. Price has reclaimed its shorter-term moving averages, the RSI is improving near 59, and the MACD histogram has turned positive.
Now I’m watching whether the XLB can reclaim its 200-day SMA around $51.32.
Utilities XLU 0.00%↑ gained 1.93%, continuing its rebound above the shorter-term averages while remaining below the 200-day SMA. There’s improving momentum, but overhead resistance still matters.
Meanwhile, Technology XLK 0.00%↑ fell sharply, Communication Services XLC 0.00%↑ slipped below its 20-day SMA, and Industrials XLI 0.00%↑ declined 0.88%.
My takeaway: The XLP and XLE are running, but stretched. The XLB is approaching a technical test, while the XLU is recovering below longer-term resistance. I’m watching for confirmation and better entries—not chasing last week’s winners.
III. Important Secondary Assets & Industries
The industry charts show a market moving in opposite directions.
Oil and gas exploration XOP 0.00%↑ is leading, semiconductors SOXX 0.00%↑ are getting hammered, and several beaten-down groups are trying to recover, but a bounce isn’t a breakout.
The XOP is showing the clearest strength, trading above its key moving averages with RSI near 65. Momentum remains strong, but money flow is getting stretched. I’m watching for a pullback rather than chasing the rally.
The SOXX is telling a different story. Price has broken below its shorter-term moving averages, RSI is near 31, and selling pressure remains heavy. The 200-day SMA is the next major area I’m watching if the decline continues.
Regional Banks KRE 0.00%↑ are attempting to stabilize around their 200-day SMA, while Homebuilders XHB 0.00%↑ have edged back above the 5-day EMA.
Both deserve attention, but I want to see follow-through before treating either as a confirmed recovery.
Small Caps IWM 0.00%↑ remain weak, trading below the 200-day SMA with RSI near 32. Gold Miners GDX 0.00%↑ are showing early improvement above the 5-day EMA, but still face resistance from their longer moving averages.
My focus for the week ahead: XOP for a pullback, SOXX and IWM for signs that selling pressure is easing, and KRE, XHB, and GDX for confirmation.
Strength is obvious. The next opportunity may be hiding in the recovery setups
👑 WANT TO KEEP READING?
This is where the free preview ends, but the Sunday Market Playbook keeps going.
Become a paid subscriber to unlock the full Playbook, plus my Wednesday Top Pick of the Week and everything else I’m researching and watching.
And for October, the annual subscription is 22% off.
Unlock the rest of the Playbook and come join us. 👑