


Welcome back to your weekly market checkup!
I hope you had an amazing week!
ICYMI, you can see the latest Top Pick of the Week here →

A quick highlight from last week →
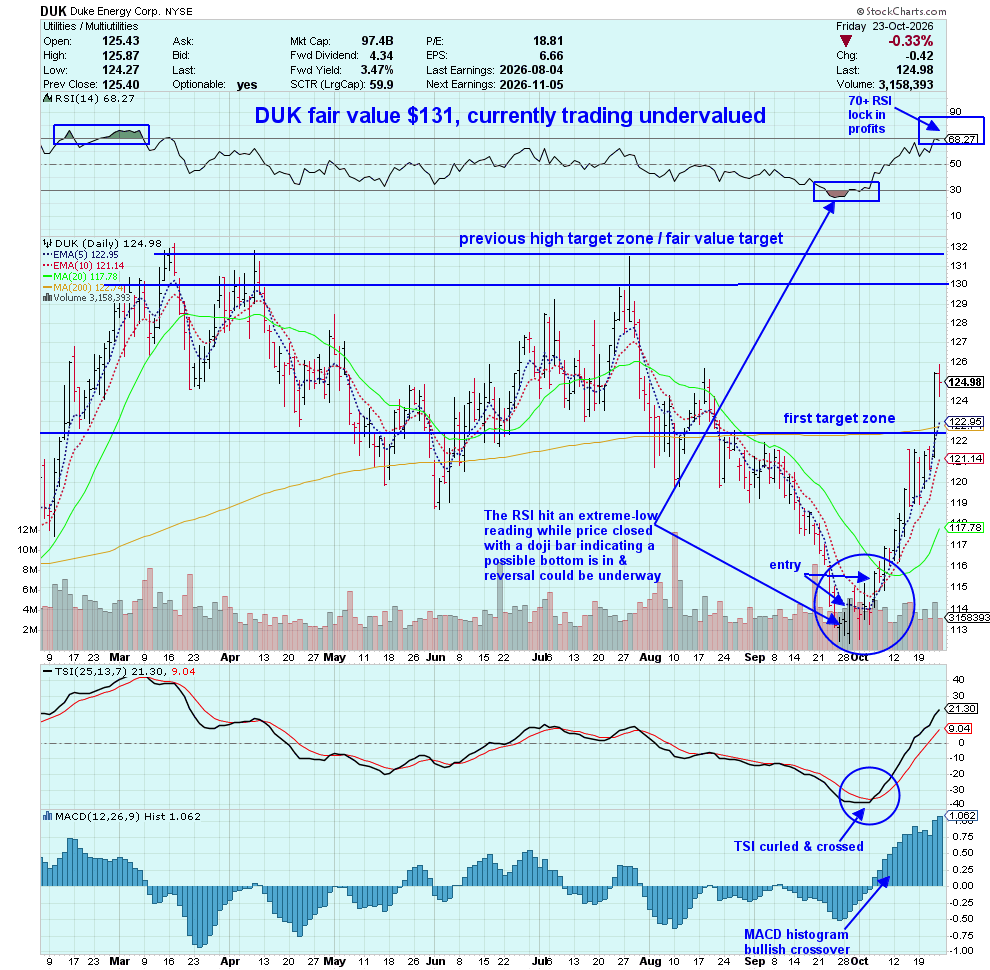
⚡ DUK — First Target Reached! 🎉 Time to Review the Exit Plan 👑
DUK was one of our Top Picks of the Week back on September 30, 2026, and it has now reached our first target: the 200-day SMA! Now the focus shifts to managing the trade.
For swing traders: With the first target reached, this is a good time to review your exit plan and consider taking profits. I’m also watching the RSI for an extreme-high reading that could signal stretched momentum.
For position traders: Taking partial profits near the first target while keeping a portion for a potential move toward fair value is another approach, provided the longer-term thesis remains intact.
Remember: Don’t cut your winners too short, but don’t ignore your exit plan either. Let your strategy, not your emotions, decide when to ring the register.
👑 BEFORE WE GET INTO THE PLAYBOOK...
For the month of October, you can get 22% off an annual Nurse in the Market subscription.
Paid subscribers get the full Sunday Market Playbook every week, plus my Wednesday Top Pick of the Week and the research and trade ideas I’m watching along the way.
You can start today’s Playbook for free, but the full post is for paid subscribers.
So if you’ve been hanging out on the free side waiting for a reason to join us...
22% off. October only. Come join us. 👑
Let’s dig into last week’s market recap and the playbook for the week ahead →
My watchlist is growing, but my buy list isn’t.
That’s where I stand heading into the final trading week of October.
Last week, oil led my seven major assets while gold finished last. The Dow held its breakout, but the S&P 500 SPY 0.00%↑ and the Nasdaq QQQ 0.00%↑ couldn’t maintain theirs.
Meanwhile, Energy XLE 0.00%↑ , Healthcare XLV 0.00%↑ , and Real Estate XLRE 0.00%↑ led the sectors as Technology XLK 0.00%↑ and Communication Services XLC 0.00%↑ struggled.
And here’s something interesting: Software stocks IGV 0.00%↑ were breaking out while Semiconductors SOXX 0.00%↑ were testing support.
Investors appear to be questioning the cost of AI infrastructure while looking for businesses that can profit from AI services.
I’m finding potential opportunities in beaten-down stocks, particularly technology and semiconductors, but attractive valuations don’t guarantee attractive entries.
I want to see the major indexes establish a bottom and buyers return before adding new positions.
With the Fed, major technology earnings, and important economic reports ahead, I’m watching more than I’m trading. Let’s get into the charts. 👑
I. The Big Picture: Seven Major Assets. Selective Leadership.
Last week’s performance rankings told an interesting story: USO → TLT → DIA → SPY → QQQ → BTCUSD → GLD.
Oil USO 0.00%↑ and bonds TLT 0.00%↑ led, the Dow Jones DIA 0.00%↑ showed relative strength, and Gold GLD 0.00%↑ and Bitcoin ($BTCUSD) lagged.
However, the biggest question heading into this week is whether the DIA can continue holding its breakout while the SPY and the QQQ struggle.
USO led the week, with an RSI reading near 72. Rising geopolitical tensions and elevated crude prices provide a fundamental backdrop for the rally.
Technically, USO’s momentum is strong, but that extreme-high RSI reading makes this more interesting for profit-taking or position management than chasing a fresh entry.
The TLT finished second, with RSI near 63, advancing toward its 200-day SMA. The move coincided with falling Treasury yields TLT 0.00%↑ vand weakness in technology stocks XLK 0.00%↑ .
The DIA is still holding its breakout. The SPY and QQQ aren’t.
That divergence is one of the week’s most important developments.
Strength in established blue-chip and dividend-paying companies suggests investors are becoming more selective, but can the DIA continue outperforming if technology remains weak?
The SPY failed to hold its breakout and closed below its 20-day SMA.
Friday also printed a doji, signaling indecision between buyers and sellers. A doji can appear near a reversal, but the next move matters more than the bar itself.
The QQQ also failed to maintain its breakout as selling pressure continued across technology. Concerns about AI capital spending provide one possible explanation, particularly with semiconductor stocks under pressure.
I’m interested in the long-term opportunities developing here, but I want price confirmation before adding exposure. I’m watching for stabilization in the QQQ and improving momentum in semiconductors.
Bitcoin’s attempted breakout didn’t hold, leaving its developing base under pressure.
The key question is whether buyers defend support or price breaks lower. I’m watching for support, sideways consolidation, and renewed buying pressure.
GLD finished last and declined below its 200-day SMA. I’m looking for price stabilization and a close above the 5-day EMA while putting in the accumulation zone.
The Dow Jones DIA 0.00%↑ is holding its breakout while the SPY and the QQQ are struggling.
That could be a healthy rotation into other areas of the market, or an early warning that weakness is spreading.
For now, I’m watching which index confirms the next move. The market doesn’t need me to predict the bottom. It needs to show me one.
Here’s how the 7 major asset classes ranked this week
Oil USO 0.00%↑
20 Year Bonds Treasury ETF TLT 0.00%↑
The Dow Jones 30 DIA 0.00%↑
The S&P 500 SPY 0.00%↑
The S&P 500 SPY 0.00%↑
Bitcoin ($BTCUSD)
Gold GLD 0.00%↑
♥️ Market Pulse: 3/7
3/7 assets are up.
DIA, USO, TLT are up.
BTC, GLD, SPY, QQQ are down.
II. Section Rotation: Selective Strength Across the Market
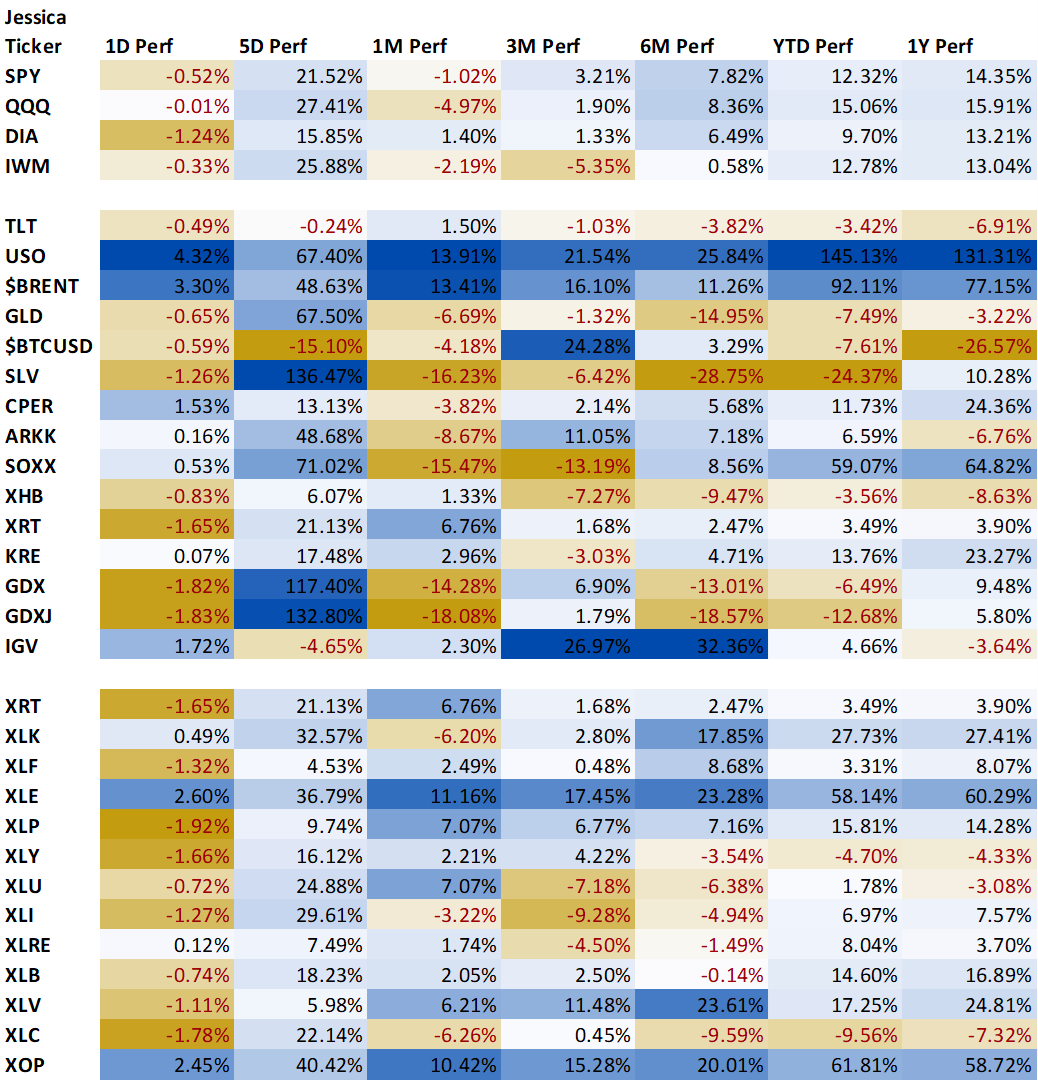
Eight of the 11 S&P 500 sectors finished higher last week, but technology XLK 0.00%↑ wasn’t leading the advance.
Energy XLE 0.00%↑ , Healthcare XLV 0.00%↑ , and Real Estate XLRE 0.00%↑ were the top three performers, while Communication Services XLC 0.00%↑ , Industrials XLI 0.00%↑ , and Technology XLK 0.00%↑ finished at the bottom.
The XLE reached an extreme-high RSI reading, while the XLV approached one. Both sectors showed strong momentum, but those elevated readings also put profit-taking opportunities on my radar rather than fresh entries.
Another interesting development was the similar price action in the XLE, Utilities XLU 0.00%↑ , and Treasury bonds TLT 0.00%↑ .
All three are sensitive to interest rates, and their strength alongside declining Treasury yields is worth watching ahead of Wednesday’s Fed decision. Utilities may also be attracting defensive buying.
Communication services XLC 0.00%↑ and the XLI were trading below their 200-day SMAs, adding to the weakness among last week’s laggards.
Meanwhile, software stocks showed relative strength even as the broader technology sector struggled—a divergence I’ll explore in the industry-group review.
Consumer Discretionary XLY 0.00%↑ briefly reclaimed its 200-day SMA, but couldn’t hold it.
With technology and communication services also struggling, the sector charts are showing selective strength rather than a broad-based rally.
III. Important Secondary Assets & Industries: Software Breaks Out While Semiconductors Struggle
One of last week’s most interesting developments was the divergence between software IGV 0.00%↑ and semiconductors SOXX 0.00%↑ .
The IGV was breaking out while the SOXX continued declining, testing its 200-day SMA with RSI near 31. Two areas of technology, two very different charts.
The fundamental backdrop raises an interesting question: Can companies spending billions on AI infrastructure generate enough returns to justify those investments?
Investors may be shifting their attention toward software businesses capable of turning AI into profitable services.
The question is shifting from who’s building AI to who’s making money from it.
That doesn’t mean semiconductor demand has peaked or every software company will benefit.
For now, the SOXX is testing an important technical level. I’m watching whether buyers defend its 200-day SMA and momentum begins improving. Until then, the IGV has the stronger technical picture.
👑 WANT TO KEEP READING?
This is where the free preview ends, but the Sunday Market Playbook keeps going.
Become a paid subscriber to unlock the full Playbook, plus my Wednesday Top Pick of the Week and everything else I’m researching and watching.
And for October, the annual subscription is 22% off.
Unlock the rest of the Playbook and come join us. 👑