


Welcome back to your weekly market checkup!
I hope you had an awesome week!
ICYMI, you can see the latest Top Pick of the Week here →
Top Pick of the Week: Strong Growth, But Is It a Buy?

Amazon caught my attention in Sunday’s Market Playbook when it was trading around $242, roughly 14% below Morningstar’s $280 fair-value estimate.
A quick highlight from last week →
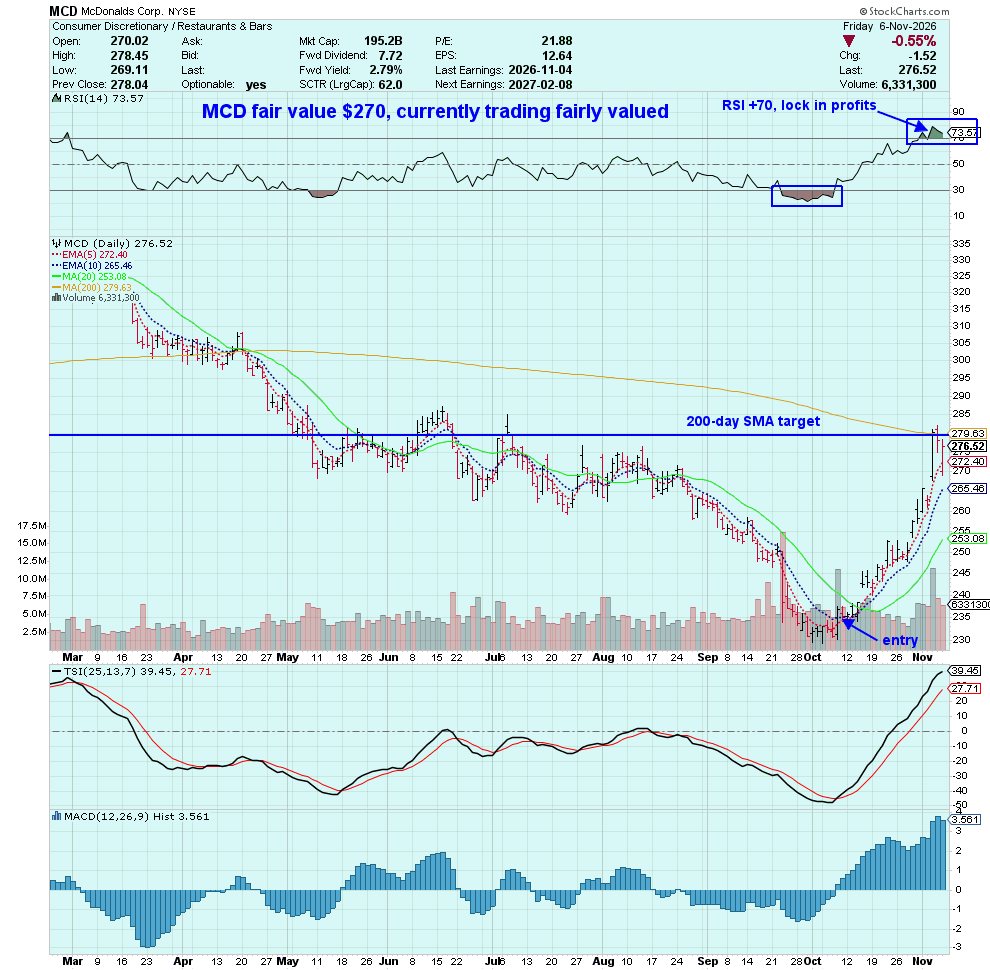
🏆 Top Pick Follow-Up: MCD Hits Its Target — Another 200-Day SMA Win!
On September 23, 2026, we featured McDonalds Corp. MCD 0.00%↑ as our Top Pick of the Week, with its 200-day SMA as our price target. MCD has now reached that target, completing the trade setup exactly as planned.
Like our previous Duke Energy Corp. DUK 0.00%↑ pick, which also reached its 200-day SMA target, this is another example of letting the chart guide our decisions.
With MCD now trading around fair value, the opportunity we originally identified has played out and it’s time to look for the next one! Congratulations to you in the MCD trade! 🎉
Let’s dig into last week’s market recap and the playbook for the week ahead →
Gold Rallies, Oil Crashes, & Technology Loses Its Footing
Gold GLD 0.00%↑ rallied 4.71%, Oil USO 0.00%↑ plunged 12.10%, and the Nasdaq-100 QQQ 0.00%↑ lost nearly 5%.
That’s not your typical week in the market.
Only two of our seven major asset classes finished in the green: gold GLD 0.00%↑ and bonds TLT 0.00%↑ . The Dow Jones DIA 0.00%↑ , the S&P 500 SPY 0.00%↑ , Bitcoin ($BTCUSD), the QQQ, and USO all declined.
However, here’s what caught my attention: Last week wasn’t one big selloff. Several different risks were being repriced at once.
I. The Big Picture
Here’s how the 7 major asset classes ranked this week:
20 Year Bonds Treasury ETF TLT 0.00%↑
Gold GLD 0.00%↑
The Dow Jones 30 DIA 0.00%↑
Oil USO 0.00%↑
Bitcoin ($BTCUSD)
The S&P 500 SPY 0.00%↑
The Nasdaq-100 QQQ 0.00%↑
♥️ Market Pulse: 2/7
2/7 assets are up.
TLT & GLD are up.
USO, BTC, DIA, SPY, QQQ are down.
Technology stocks XLK 0.00%↑ faced renewed selling pressure as investors questioned the enormous cost of building AI infrastructure and how quickly those investments would produce profits.
The midterm elections added uncertainty around future regulation and data-center development.
Meanwhile, oil USO 0.00%↑ reacted to changing geopolitical expectations. Reports of a possible easing in U.S.–Iran tensions raised the prospect of additional oil supply reaching global markets, putting pressure on prices.
Friday’s stronger-than-expected October jobs report complicated the picture further. A resilient labor market is encouraging for the economy, but it can also give the Federal Reserve more reason to keep interest rates elevated.
And that’s the tension investors were dealing with: economic resilience on one side, expensive growth expectations and interest-rate uncertainty on the other.
Gold GLD 0.00%↑ was the clear winner, gaining 4.71% as investors sought defensive exposure, but despite that impressive weekly return, GLD finished Friday at $372.52, just below its 20-day SMA near $372.79 and well below its 200-day SMA.
Bonds showed a different picture. TLT gained only 0.52%, yet its short-term trend was stronger, trading above its 5-day EMA and 20-day SMA as it approached its 200-day SMA near $82.81.
Gold had the stronger weekly performance. Bonds had the stronger short-term technical setup.
In stocks, the Dow Jones DIA 0.00%↑ held up considerably better than the QQQ. The DIA lost just 0.95%, compared with the QQQ’s 4.98% decline.
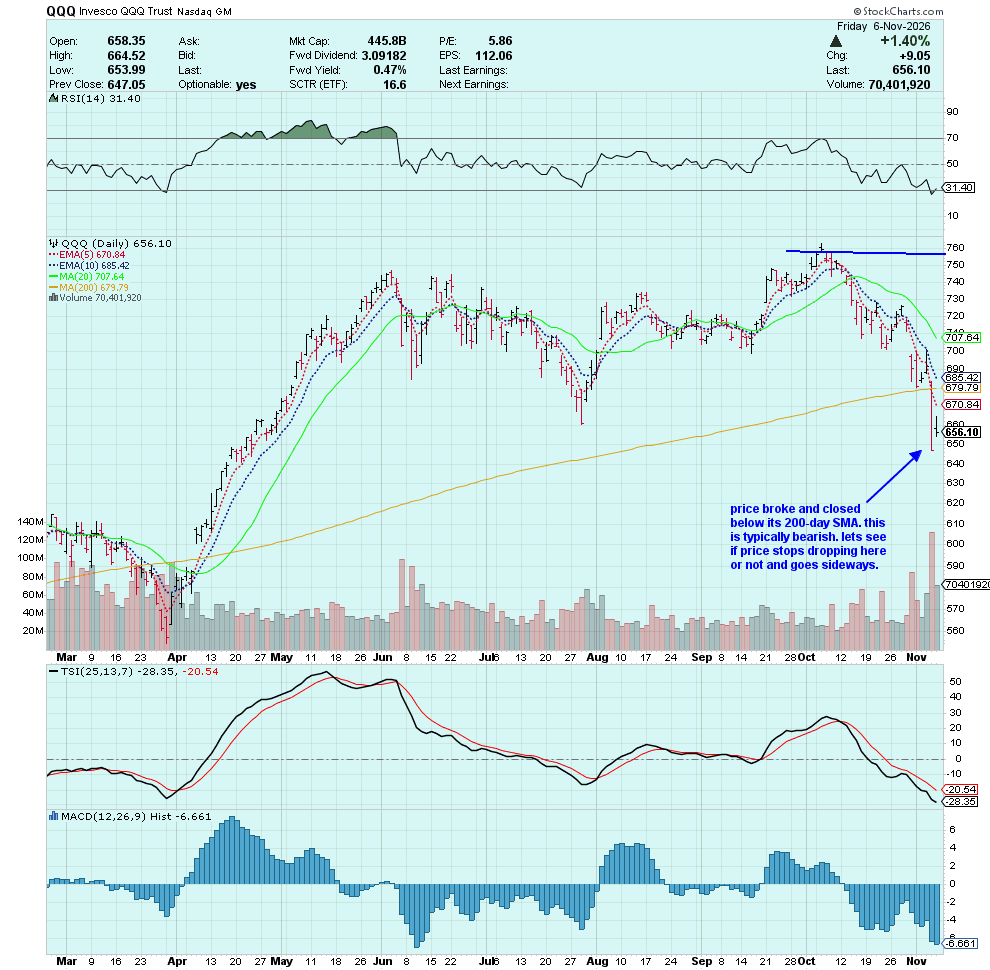
Both the DIA and the SPY experienced failed breakouts, but they remained above their 200-day moving averages. The QQQ wasn’t so fortunate.
The QQQ closed at $656.10, below its 200-day MA near $679.79, with an RSI reading around 31. Friday’s rebound was encouraging, but the QQQ remained below its shorter-term moving averages.
An oversold market can bounce. That doesn’t mean the downtrend is over.
Bitcoin also struggled, losing 3.21%.
Its short-term momentum weakened alongside equities, although it remained above its 200-day moving average on our November 8 chart.
That distinction matters, but BTC certainly wasn’t providing much protection from market volatility.
And then there’s oil USO 0.00%↑ . USO’s 12.10% decline was the largest of our seven assets.
The selloff pushed prices below the shorter-term moving averages, although USO remained well above its 200-day MA. Its RSI reading near 42 also suggests we shouldn’t assume the selling has exhausted itself.
One of the most interesting developments came Friday, when TLT, SPY, and USO all formed doji-like candles.
A doji forms when an asset opens and closes at nearly the same price. It can reflect hesitation between buyers and sellers, but the surrounding price action matters.
TLT’s doji appeared after a recovery, with bonds approaching their 200-day moving average.
The SPY’s doji formed after a sharp decline, just above its 200-day SMA near $727.65.
USO’s doji followed a steep selloff, with prices recovering from Friday’s low of $146.70.
Same candle pattern. Three very different situations. None confirms a reversal on its own.
For next week, I’m watching whether the SPY can defend its 200-day SMA, whether the QQQ can reclaim its 5-day EMA near $670.84, and whether USO can hold Friday’s low.
I’ll also be paying attention to TLT’s approach toward its 200-day SMA and whether gold can reclaim its 20-day SMA.
Those are reference levels from Friday’s charts, not automatic buy or sell signals.
👑 My Macro Takeaway: Patience is still the trade
Last week’s market action showed investors responding to several different concerns.
Gold (GLD) and bonds (TLT) attracted relative strength, technology XLK 0.00%↑ suffered another round of selling, and oil experienced a sharp geopolitical repricing.
The technical picture was equally mixed.
We saw failed breakouts, weakening momentum, and several Friday candles showing hesitation, but hesitation isn’t confirmation that the market has found a bottom.
I prefer to see three to four trading sessions of stabilization, support levels holding, and prices beginning to reclaim their shorter-term moving averages before getting more aggressive.
There may be attractive opportunities developing, especially in beaten-down technology stocks, but cheaper prices don’t automatically mean better entries.
Right now, I see more potential setups than actual buy signals and I’m not forcing a trade until the charts give me a reason.
II. Sector Rotation: Where is The Strength?
Last week, five of the 11 S&P 500 sectors finished higher, while six declined, but the real story wasn’t how many sectors were green or red.
It was the enormous difference between the winners and losers.
Communication Services XLC 0.00%↑ led with a 4.89% gain, while technology XLK 0.00%↑ fell 8.23%—a remarkable 13.12-percentage-point gap between two sectors that share some growth-oriented characteristics.
What The Rotation Is Telling Us
Investors were selective, even within growth-oriented areas of the market.
Communication services XLC 0.00%↑ stood out while technology suffered a significant breakdown. The XLK fell below its 200-day SMA, echoing the weakness we saw in the QQQ. That makes XLC’s relative strength particularly interesting.
Real Estate XLRE 0.00%↑ and Consumer Discretionary XLY 0.00%↑ also outperformed, but both hit extreme-high RSI readings. In my trading approach, that’s an extreme-high reading and a reason to consider taking profits rather than chasing an extended move.
Materials XLB 0.00%↑ and Health Care XLV 0.00%↑ also showed extreme-high RSI readings, reminding us that a sector’s weekly return doesn’t tell the whole technical story.
At the other end, Energy XLE 0.00%↑ plunged 12%, reinforcing the oil weakness we discussed earlier. Industrials XLI 0.00%↑ declined 2.83% and finished Friday with a doji, suggesting hesitation after selling pressure, but no confirmed reversal.
Financials XLF 0.00%↑ and Consumer Staples XLP 0.00%↑ held up relatively well, while Utilities XLU 0.00%↑ slipped. So this wasn’t a simple rotation into every defensive sector.
👑 My Sector Takeaway: Follow Strength, Don’t Chase It
The XLC is my most interesting sector to investigate for a potential trade this week, particularly through stocks such as META, GOOGL, RDDT, and VZ.
Its leadership deserves attention, but I’ll still look for favorable entries and confirmation on the individual charts.
Meanwhile, extreme-high RSI readings across several sectors put profit protection on my radar, while the XLK’s break below its 200-day SMA calls for caution.
The lesson from this week’s rotation?
The strongest sector isn’t automatically the best buy, and the weakest isn’t automatically a bargain.
I’m looking for strength with a sound entry, not simply buying whatever had the best week.
III. Important Secondary Assets & Industries: Gold Miners Surge While Semiconductors Break Down
Gold miners GDX 0.00%↑ surged more than 13% last week, while Semiconductors SOXX 0.00%↑ fell 13.13%.
That nearly 27-percentage-point gap was one of the clearest signs of how differently investors treated these industries and the divide extended beyond those two groups.
Gold miners were the week’s standout performers.
GDX gained 13.63% and GDXJ rose 13.45%, nearly three times gold’s GLD 0.00%↑ 4.71% advance.
Mining stocks can amplify movements in gold prices because higher selling prices can have an outsized effect on profitability. After such a sharp rally, though, I’d rather see how these gains hold up than chase them.
At the other extreme, oil and gas exploration stocks XOP 0.00%↑ plunged 14.72%, extending the weakness we saw across energy.
Technology-related industries also struggled. The SOXX fell 13.13%, software IGV 0.00%↑ lost 5.19%, and innovation-focused ARKK declined 6.55%.
The selling wasn’t universal. Homebuilders XHB 0.00%↑ gained 1.31%, Retail XRT 0.00%↑ rose 0.88%, and Regional Banks KRE 0.00%↑ edged up 0.26%.
These weren’t spectacular gains, but they showed that some economically sensitive groups held up better than the broader market.
Why Semiconductors Still Deserve Attention
As AI infrastructure costs climb, companies developing cheaper, workload-specific chips could become increasingly important.
That’s a reason to investigate businesses such as Broadcom (AVGO), Marvell (MRVL), and Taiwan Semiconductor Manufacturing (TSM).
Nvidia (NVDA) still has significant competitive advantages, and growing demand for custom chips doesn’t automatically mean its business will suffer.
The SOXX may offer exposure to the next phase of AI spending, but after a 13.13% weekly decline, its technical chart needs time to recover. The long-term industry opportunity and the short-term trade setup are two separate questions.
👑 My Industry Takeaway: Two Recovery Setups to Watch
My two recovery candidates for next week are SOXX and IWM.
The SOXX is worth monitoring as the AI industry searches for more cost-efficient computing solutions, although last week’s selloff left substantial technical damage.
Small caps IWM 0.00%↑ offer a more defined setup.
The IWM fell 2.03%, its recent breakout failed, and price slipped back below its 200-day SMA.
If support holds and the IWM reclaims its 5-day EMA, that could be our first sign of a recovery attempt and reclaiming the 200-day SMA would provide stronger confirmation.
Two potential opportunities. Neither has earned an entry yet.
👑 WANT TO KEEP READING?
This is where the free preview ends, but the Sunday Market Playbook keeps going.
Become a paid subscriber to unlock the full Playbook, plus my Wednesday Top Pick of the Week and everything else I’m researching and watching.
Unlock the rest of the Playbook and come join us. 👑