


Sometimes the most interesting chart isn’t sitting at the top of the leaderboard.
It’s the ugly one.
The sector that’s been beaten down and the stock trading below its longer-term moving average.
The chart nobody seems particularly excited about because that’s when I start asking: Is the selling finally getting exhausted?
This week, I’m looking at Utilities XLU 0.00%↑ and my Top Pick of the Week is Duke Energy Corp. DUK 0.00%↑ .
I’m not trying to call the exact bottom.
I’m waiting for the chart to give me permission to participate and DUK just did.
Here’s the setup →
Start With The Big Picture
The broader market is mixed.
The S&P 500 SPY 0.00%↑ tested its 20-day SMA Tuesday and closed back above it, while the major indexes ultimately finished slightly lower.
Semiconductors SOXX 0.00%↑ continue to show relative strength.
Meanwhile, Treasury yields remain a major headwind for rate-sensitive areas of the market, with the 10-year Treasury yield reaching levels not seen since 2007.
→ So instead of chasing another area that’s already running, I’m looking at the opposite side of the market.
Utilities have been getting smashed and now they’re trying to get back up.
First Stop: Utilities
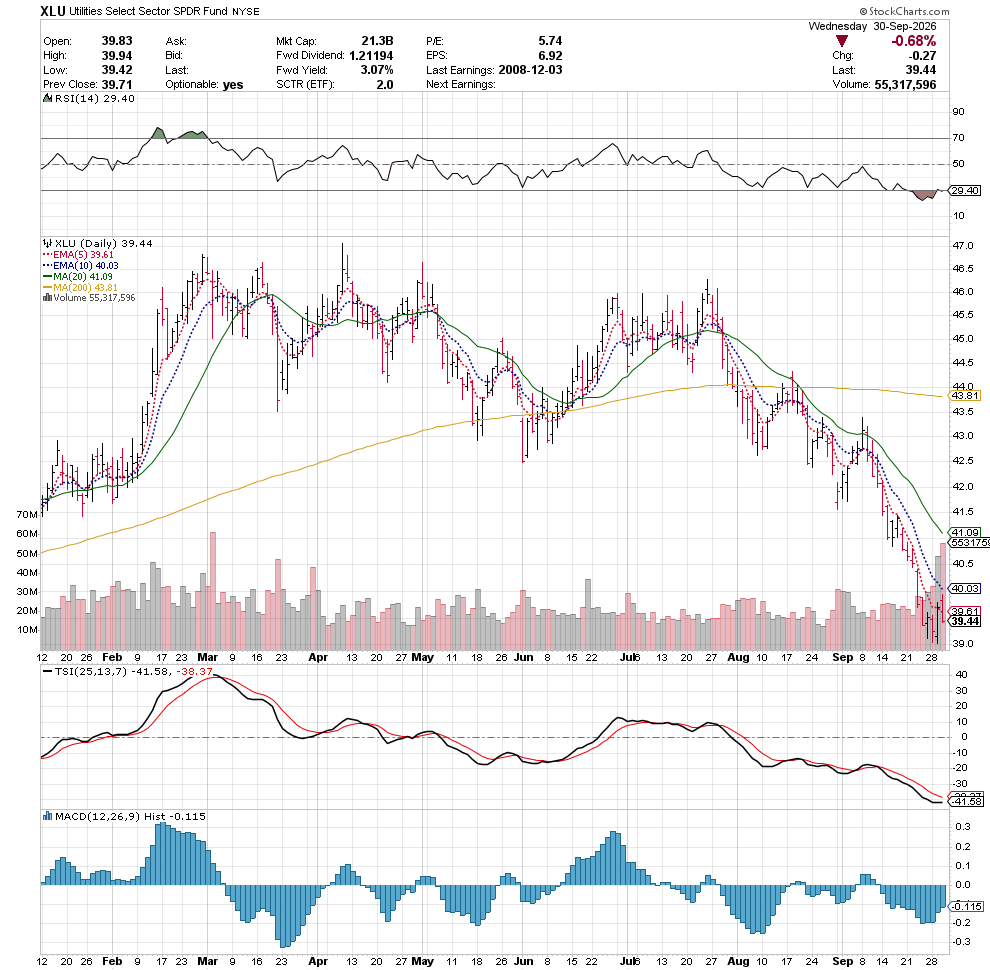
XLU, the Utilities Select Sector SPDR Fund, has fallen below its 200-day SMA.
The RSI recently reached an extreme-low reading below 30.
That’s where my radar goes up, but an extreme-low RSI reading isn’t an entry trigger.
Oversold can stay oversold.
I need price confirmation and now I have it.
XLU closed back above its 5-day EMA while trading in its accumulation zone.
→ That’s my accumulation entry trigger.
Now I want to know if I’m seeing the same behavior underneath the ETF which I am.
Meet Duke Energy
Before we buy the chart, let’s talk about the company behind the ticker.
Duke Energy Corp. DUK 0.00%↑ is one of the largest energy companies in the United States.
Its regulated utilities generate, transmit and distribute electricity to millions of customers across the Carolinas, Florida, Indiana, Ohio and Kentucky. DUK also operates regulated natural gas utilities in parts of its territory.
In plain English?
DUK owns infrastructure people and businesses depend on every single day and electricity demand is becoming a much bigger story.
Population growth, manufacturing, electrification, and massive data centers are putting more demand on the power grid.
→ Someone has to generate that electricity, someone has to move it, and someone has to build the infrastructure required to support it.
That’s DUK’s business.
Then there’s the income story.
DUK has paid a quarterly cash dividend for 100 consecutive years.
→ So we’re looking at an established utility with essential infrastructure, recurring customer demand, and a long history of returning cash to shareholders.
Now let’s look at what happened to its stock.
Fundamentals Meet Valuation
According to the Morningstar data I reviewed, DUK carried a 4-star rating and was trading at roughly a 13% discount to estimated fair value of $131 when I performed my research and here’s an important distinction:
Below the 200-day SMA doesn’t automatically mean cheap.
The chart tells me about the stock’s technical condition.
Morningstar’s fair value estimate gives me a separate perspective on valuation.
I want both.
A business I understand.
A valuation worth investigating and a chart giving me a reason to act.
Which brings us to DUK.
DUK chart annotation →
The DUK Setup
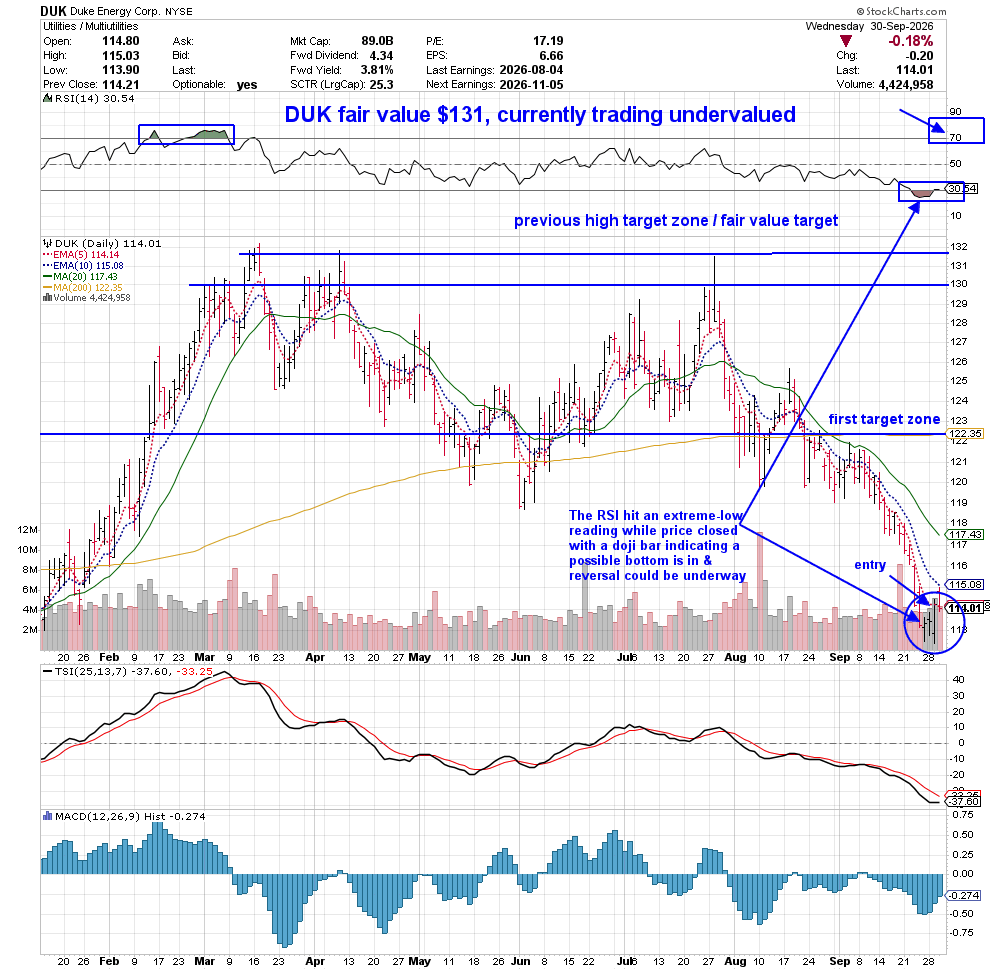
DUK is trading below its 200-day SMA, putting it in an area where I’m looking for potential accumulation opportunities.
Then the indicators started talking.
The RSI reached an extreme-low reading.
On Monday, DUK printed a doji bar after the decline, showing indecision after heavy selling.
Then price did what I was waiting for.
DUK closed above its 5-day EMA.
There’s my accumulation trigger and underneath price, the MACD histogram has started ticking upward, suggesting downside momentum may be beginning to ease.
Put it together:
Extreme-low RSI reading.
Doji after the selloff.
Close above the 5-day EMA.
MACD histogram ticking upward.
One indicator doesn’t make my trade.
The confluence does.
In other words:
→ this is an amazing buy & hold opportunity to pick up shares of DUK, an undervalued / dividend-paying trophy utility stock to hold for the long-term, if not forever.
→ we can also position trade DUK back to true value and beyond and make massive gains.
→ if you’re an experienced, astute trader, you can write option contracts on DUK and do what you do and make exponential gains.
Zoom Out
The confluence goes beyond the DUK chart.
This is my process: MARKET → SECTOR → INDUSTRY → STOCK
I’m not starting with DUK and searching for reasons to justify buying it.
I’m working from the top down. Utilities have been beaten down.
XLU reached an extreme-low RSI reading and gave me my accumulation trigger.
Then I move underneath the ETF and see similar behavior developing in individual utility stocks, including DUK, SO, FE, and AEP.
→ That’s what I want to see. The stock isn’t trying to turn by itself.
There’s evidence developing across the group.
The Elephant in the Room: Rates
Now for the part we can’t ignore.
→ Treasury yields.
The 10-year Treasury yield has pushed to levels not seen since 2007.
That’s not exactly a friendly backdrop for Utilities.
Utilities are capital-intensive businesses. Higher borrowing costs can hurt, while higher Treasury yields also make bonds more competitive with dividend-paying stocks for income-seeking investors.
So yes.
Rates are a real risk to this trade, but they’re also part of what makes the setup interesting.
DUK is giving me my technical trigger while the macro backdrop remains difficult.
→ I’m not waiting for every headline to become perfect.
I’m waiting for the chart to tell me something is changing.
What Would Prove Me Wrong?
My trigger has fired.
That doesn’t mean DUK can’t fail.
If DUK loses the 5-day EMA and rolls back toward its recent low while XLU resume their decline, the reversal attempt isn’t doing what I need it to do.
If Treasury yields continue pushing higher, pressure on rate-sensitive stocks could continue too.
That’s why I’m treating this as an accumulation setup, not declaring that I caught the bottom.
My job isn’t to predict the exact low.
→ I need my setup and I need my trigger. Then I manage what happens next.
Price gets the final vote.
Top Pick of The Week 👑
Ticker: DUK 0.00%↑
Company: Duke Energy Corp.
Sector: Utilities XLU 0.00%↑
Industry: Multiutilities
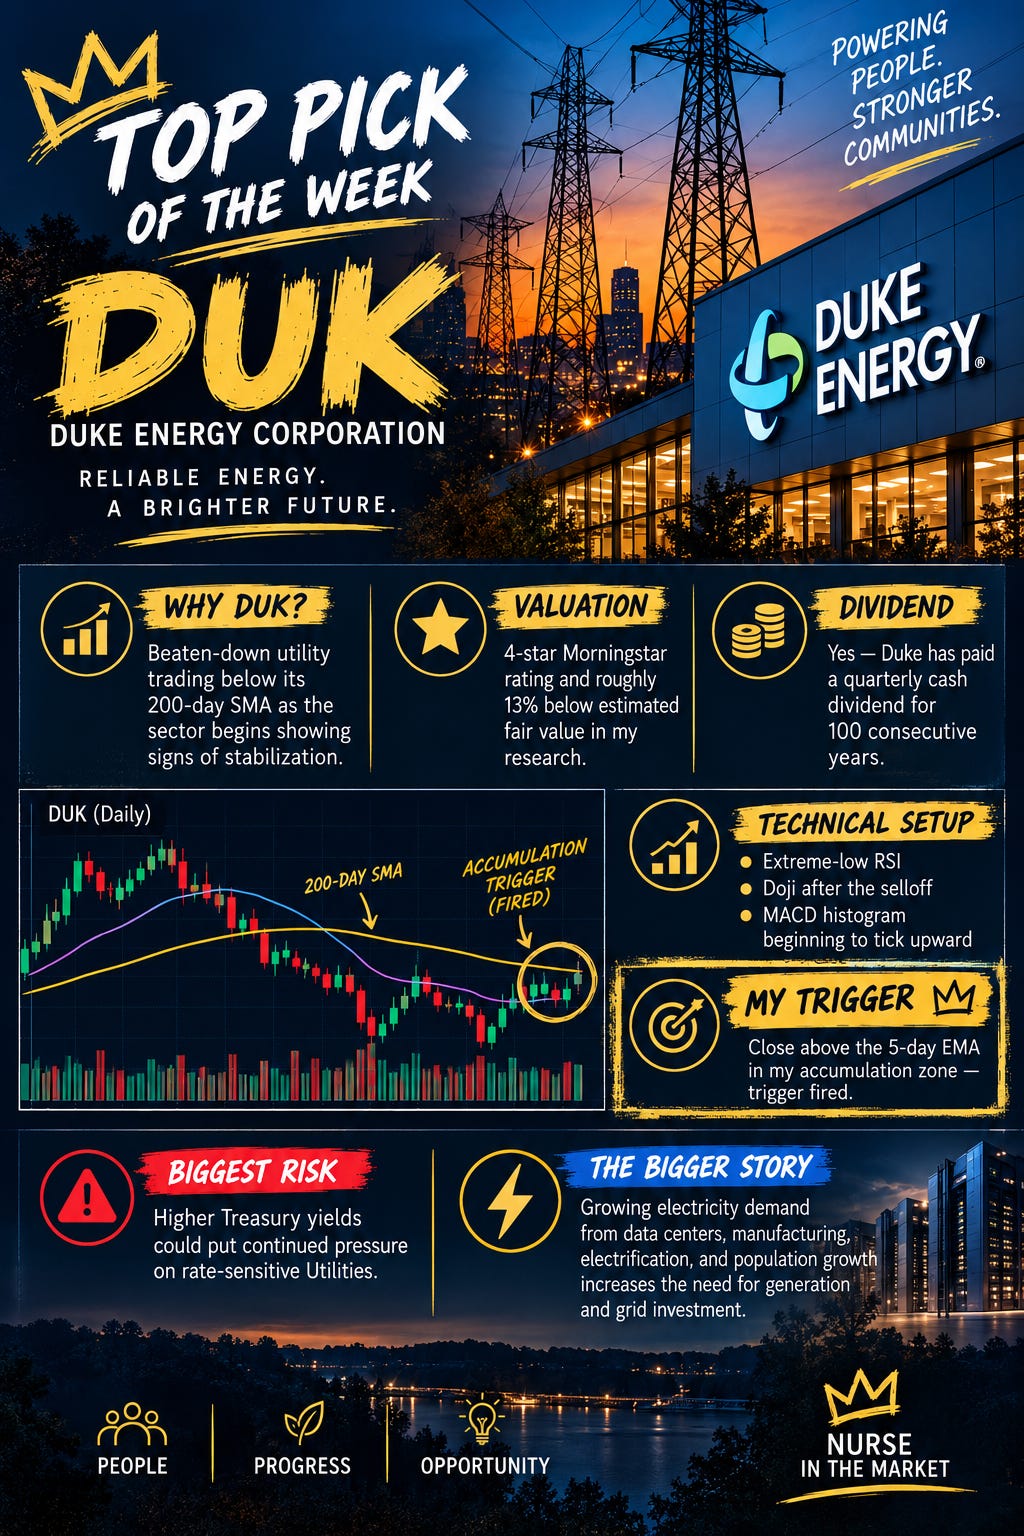
Why It’s on My Radar: Beaten-down utility trading below its 200-day SMA as both DUK and the Utilities sector begin showing signs of a turn.
Valuation: Below the Morningstar fair-value estimate of $131 in my research.
Dividend: Yes. DUK has paid a quarterly cash dividend for 100 consecutive years.
Technical Setup: Extreme-low RSI reading, a doji bar after the selloff, and the MACD histogram beginning to tick upward.
Entry Trigger: Closed above the 5-day EMA while in my accumulation zone.
What I’m Watching: Whether DUK can hold the 5-day EMA while XLU’s reversal attempt continues.
Biggest Risk: Higher Treasury yields putting continued pressure on rate-sensitive Utilities.
Power-Demand Connection: Growing electricity demand from data centers, manufacturing, electrification, and population growth increases the need for generation and grid investment.

The Bottom Line
Technology XLK 0.00%↑ is leading and semiconductors SOXX 0.00%↑ are running.
Utilities XLU 0.00%↑ are sitting on the other side of the market—beaten down, oversold, and finally showing signs of life.
Duke Energy Corp. DUK 0.00%↑ gives me an established regulated utility, exposure to growing electricity demand, a long dividend history, and a valuation worth investigating.
Then the chart gives me my trigger, but the real lesson isn’t the RSI, MACD or one bar or one candlestick.
→ It’s the process.
Market → Sector → Industry → Stock → Trigger.
Could DUK go lower? Of course.
I don’t need to predict the bottom.
I’m waiting for the chart to give me permission to participate.
This week, it did.
DUK is my Top Pick of the Week.
Following a systematic approach, reading market structure, and staying disciplined compounds over time.
Let me know what you’re watching and thank you so much for reading! 🙌
-Nurse Jess 🤝
Know the Big Picture. Focus on the Edge. 👑
Previous Articles

Top Pick of the Week: Just Dropped. Is This Trophy Stock Finally on Sale?

I almost picked a company I’d never heard of for this week’s Top Pick.
Top Pick of the Week: When Fundamentals Meet Momentum

There’s a difference between finding a company I want to own and finding the right time to pay attention to its stock.
Scan the QR code below to subscribe to Nurse in the Market→

📌 Bookmark this post. Track these setups through the week and see how they play out. This is how you develop an edge—by studying real-time trade ideas and learning what works.
Financial Disclaimer: This is not financial advice. All trades carry risk. Biotech stocks are highly volatile and speculative. Always do your own due diligence and consult with a financial advisor before making investment decisions.
Utilities have been beaten down—but now I'm seeing signs of a potential turn.
DUK gave me my accumulation trigger after reaching an extreme-low RSI reading, and XLU is showing improvement too.
The big question now: Is this the beginning of a Utilities reversal, or just a bounce before another leg lower?
I'm letting price answer that one. 👑
Are you watching DUK or any other utility stocks here?